Figure 4.
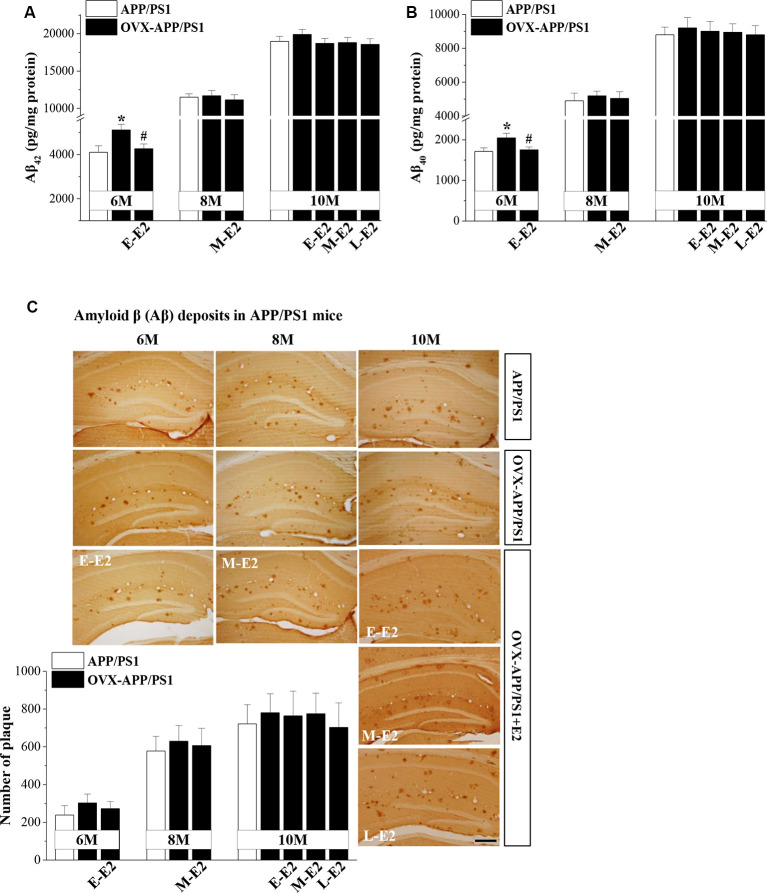
Age-related increase in Aβ accumulation and the influence of E2 on Aβ formation in the hippocampus of APP/PS1 mice. (A,B) Bar graphs showing the level of total Aβ1–42 or Aβ1–40in APP/PS1 mice that were sham-op (open bars) or OVX (black bars). *P < 0.05 vs. 6-month-old sham-op APP/PS1 mice; #P < 0.05 vs. 6-month-old OVX-APP/PS1 mice (two-way ANOVA). (C) Representative images showing Aβ immunostaining in 6-month-old, 8-month-old, and 10-month-old APP/PS1 mice that were sham-op or OVX with vehicle or E2 treatment in the early period (E-E2), mid period (M-E2), or late period (L-E2). The data show the mean counts of Aβ deposits in the hippocampus of APP/PS1 mice. Scale bar = 200 μm.

