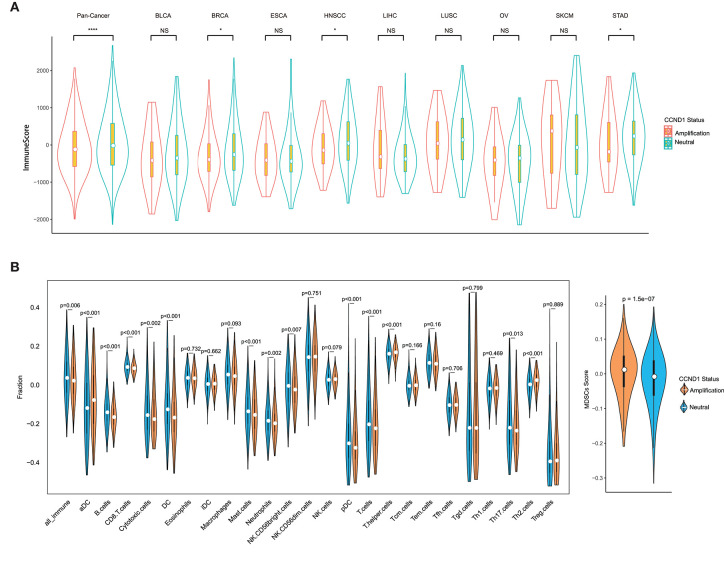
Figure 3.
Tumor purity estimate and infiltration levels of immune cells in The Cancer Genome Atlas (TCGA) pan-cancer cohort. (A) The ESTIMATE (Estimation of STromal and Immune cells in MAlignant Tumor tissues using Expression data) score of cancers between the cyclin D1 (CCND1) amplification group and the neutral group in TCGA pan-cancer cohort (n = 2,633). The white dot represents the median value. The bottom and top of the violins are the 25th and 75th percentiles (interquartile range). Differences between the two groups were evaluated by unpaired t-tests. ns P ≥ 0.05; *P < 0.05; **P < 1 × 10⁻²; ***P < 1 × 10⁻³; ****P < 1 × 10⁻⁴. (B) The measurement of the infiltration levels of 25 immune cell populations between the CCND1 amplification group and the neutral group in the TCGA pan-cancer cohort (n = 2,633). The median white dot represents the median value, while the upper and lower represent the minimum and maximum values. Differences between the two groups were evaluated by unpaired t-tests.

