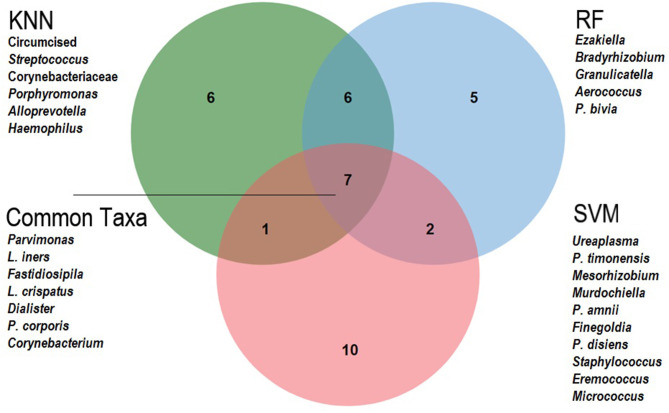
Figure 3.
Venn Diagram of 20 top-ranked meatal taxa predicting Bacterial vaginosis, by machine learning classifier. This Venn diagram shows the overlap of the top 20 important variables from each classifier: KNN, K Nearest Neighbor; RF, Random Forest; SVM, Support Vector Machine. The unique variables are listed for each classifier and the common taxa across all three are listed as indicated.

