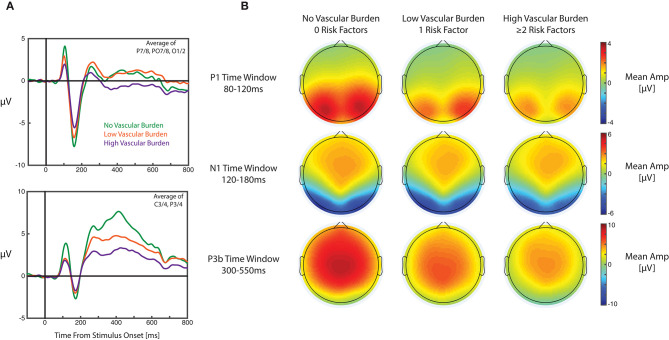
Figure 1.
Grand average ERPs and topographic plots for each cardiometabolic burden group. (A) Grand average ERP waveforms for each group averaged over electrodes P7/8, PO7/8, and O1/2 (top panel) and averaged over C3/4 and P3/4 (bottom panel). ERPs were also averaged across versions of the n-back task in these plots. (B) Topographic maps displaying mean amplitudes for each group during the measurement windows for the visual P1 (top row), visual N1 (middle row), and P3b (bottom row).

