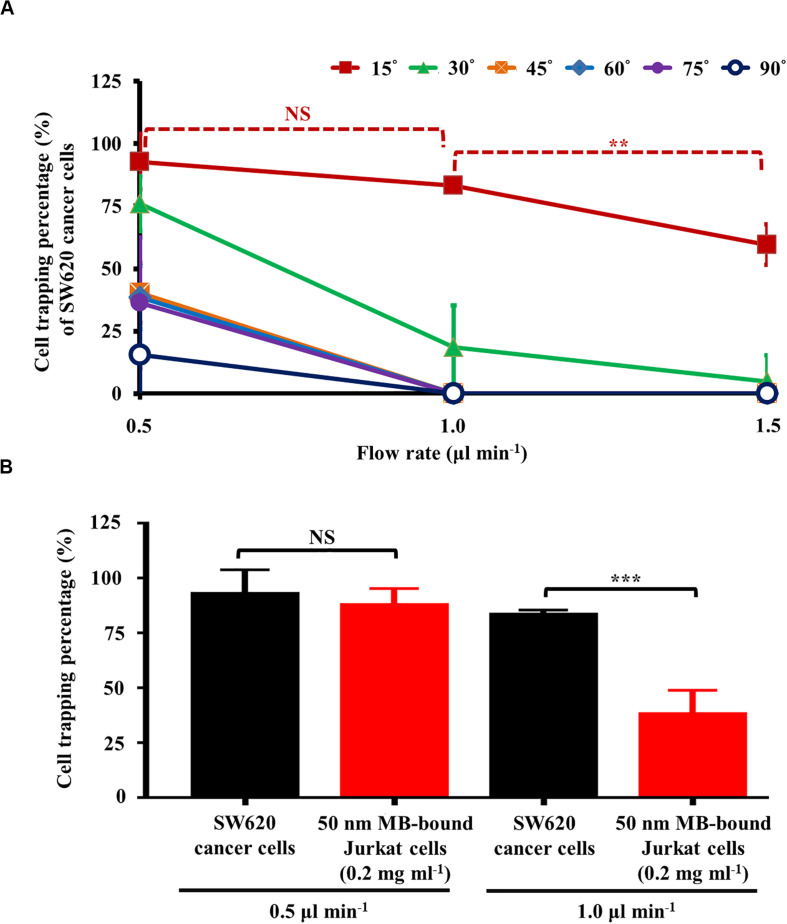
FIGURE 4.
(A) the cell trapping percentage (%) of SW620 cancer cells trapped at the rectangular light bar area under different flow rates (0.5, 1.0, and 1.5 μl min–1) and angles (i.e., the angle between the light bar image and the flow direction of the sample flow) (15°, 30°, 45°, 60°, 75°, and 90°), and (B) comparison of cell trapping percentage (%) between SW620 cancer cells and 50 nm magnetic microbead (MB)-bound Jurkat cells (concentration: 0.2 mg ml–1) under the selected flow rates (i.e., 0.5 and 1.0 μl min–1, set angle: 15°) [Data were presented as mean ± standard deviation (n > 3). One-way ANOVA and the Tukey honestly significant difference (HSD) post hoc test were used for the statistical analysis. NS, No Significant difference (p>0.05), ∗∗Significant difference (p<0.01), ∗∗∗Significant difference (p<0.001)].

