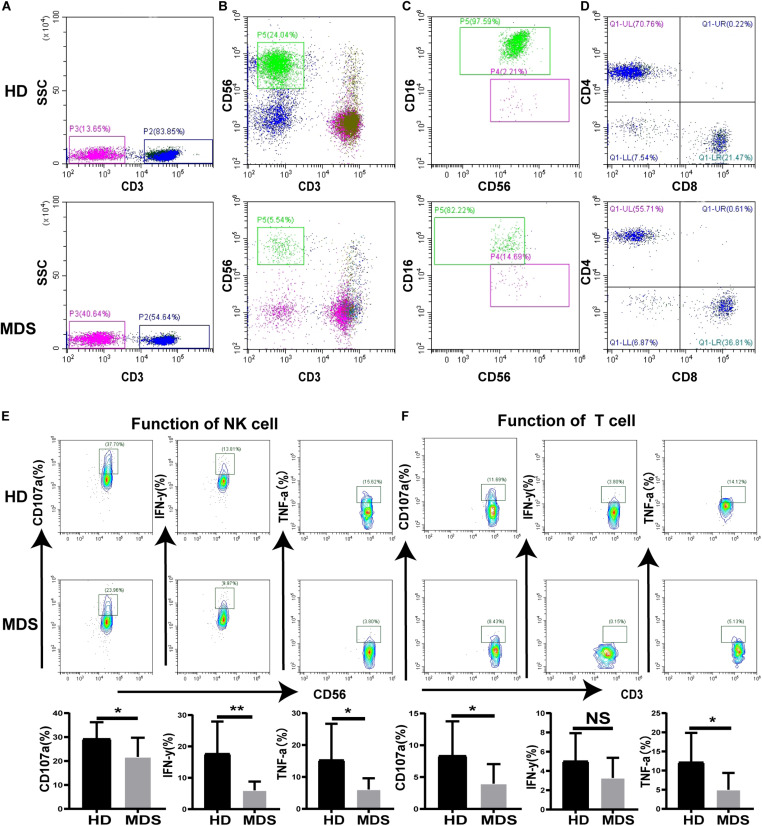
FIGURE 1.
The proportion and function of T and NK cells in MDS and HDs. (A–D) Flow cytometry analysis of T (A), NK (B), NK subgroup (C), T subgroup (D) expression levels in PB from MDS and HDs. Figure A and B shows the percentage of CD3+T cell and CD56+NK cell in all lymphocytes, respectively. Panel (C) shows the percentage of CD56+16+NK and CD56+16–NK cells in all CD56+NK cells. Panel (D) shows the percentage of CD3+CD4+T and CD3+CD8+T cells in all CD3+T cells. (E,F) CD107a, IFN-γ, and TNF-a were analyzed to investigate the function of NK (E) and T (F) cells between MDS and HDs. MDS, myelodysplastic syndromes; HDs, healthy donors; PB, peripheral blood; *P < 0.05, **P < 0.01, ***P < 0.005, ****P < 0.0001, NS denotes not significant; data are presented as mean ± SD, Statistical differences between HDs (N = 20) and MDS (N = 26) (A–D), HDs (N = 10) and MDS (N = 10) (E–F) were determined by Mann–Whitney unpaired t-test.

