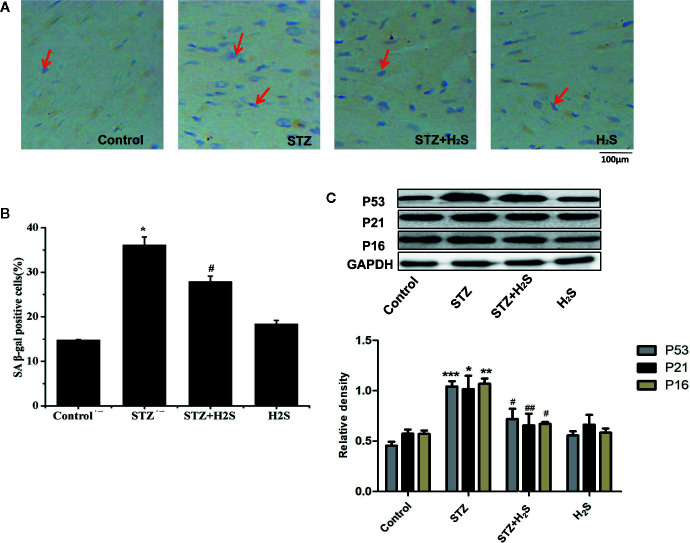
Figure 3.
(A) Proportion of SA-β-gal positive cells in myocardial tissue in treated with Control; STZ; STZ+H2S; H2S (Red arrow represents SA-β-gal positive cells); (B) Quantitative results of SA-β-gal fluorescence intensity in myocardial tissue treated with Control; STZ; STZ+H2S; H2S; (C) Western blotting analysis the expression of P53, P21, P16 in myocardial tissue treated with Control; STZ; STZ +H2S; H2S; n = 3, *p < 0.05 vs control. **p < 0.01 vs control. ***p < 0.001 vs control. #p < 0.05 vs STZ. ##p < 0.01 vs STZ. STZ, streptozotocin; H2S, hydrogen sulfide.

