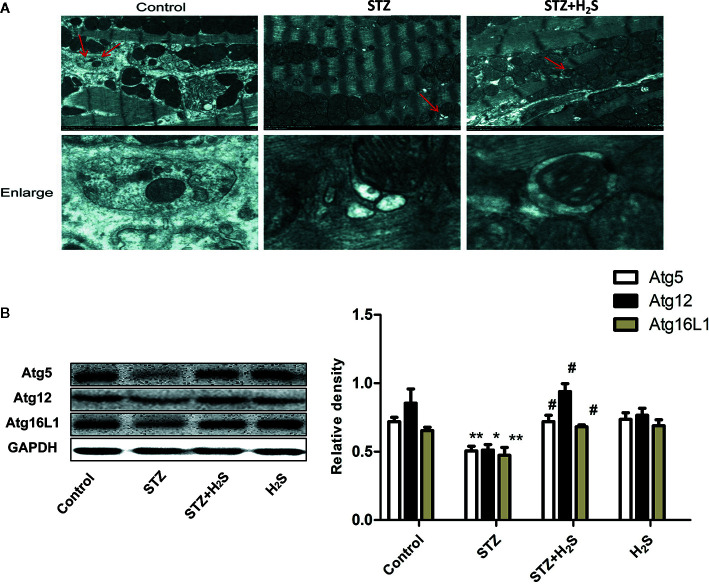
Figure 6.
H2S upregulates STZ-induced diabetic myocardial fibrosis mitophagy. (A) Representative images of transmission electron microscopy analysis the effect of STZ‐induced diabetic myocardial fibrosis in STZ-evoked mitophagy in the selected area. The insets in the above panels are magnified and are presented in the lower panel. Transmission electron micrographs at bars of 0.2 µm(Red arrow represents microscopy). (B) Western blotting analysis the expression of Atg5,Atg12,Atg16L1 in myocardial tissue treated with Control; STZ; STZ +H2S; H2S; n = 3, *p < 0.05 vs control. **p < 0.01 vs control. #p < 0.05 vs STZ. STZ, streptozotocin; H2S, hydrogen sulfide.

