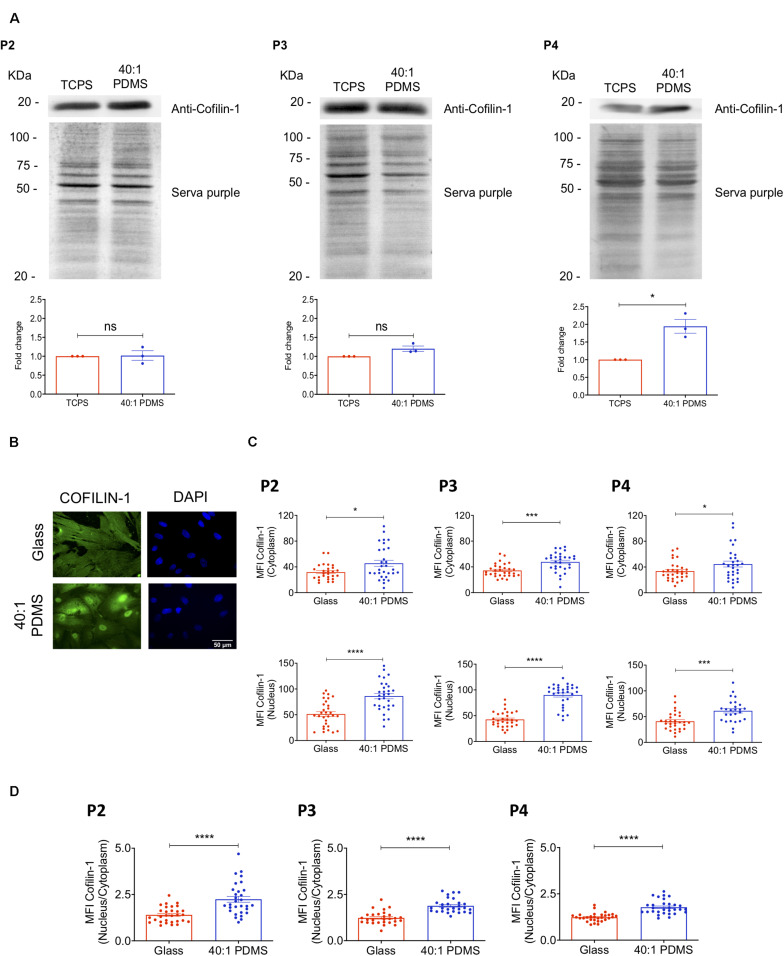
FIGURE 3.
Cofilin-1 is highly present in cells cultured on soft versus stiff substrates. (A) Western blot analysis (top) of Cofilin-1 present in whole-cell protein extracts (separated by SDS-PAGE) obtained from hUCM-MSCs isolated and cultured on TCPS until P1 and then cultured on stiff TCPS or soft 40:1 PDMS until P2, P3, or P4 (as indicated). For quantification analysis (bottom), Cofilin-1 expression was normalised using the respective total protein level assessed by staining the WB membrane using SERVA purple (top). Bars (bottom) represent mean ± SEM of three independent experiments. Statistical analysis was performed using One-Sample t-test (theoretical mean of 1.0) with significant differences indicated as *p < 0.05; ns, non-significant. (B) Representative fluorescence microscopy images and (C) respective MFI quantification of Cofilin-1 in the nucleus or cytoplasm of cells cultured on glass coverslips or 40:1 PDMS until P2, P3, or P4 (as indicated). (D) MFI quantification of Cofilin-1 ratio (nucleus/cytoplasm) present in cells cultured as in (C). Cells were fixed and stained with an anti-Cofilin-1 antibody (green) and DAPI for nuclear counterstaining (blue). In (C,D) bars represent mean ± SEM of cells analysed from three independent experiments. Statistical analysis was performed using a two-tailed Student’s t-test, with significant differences indicated as *p < 0.05, ***p < 0.001, and ****p < 0.0001.

