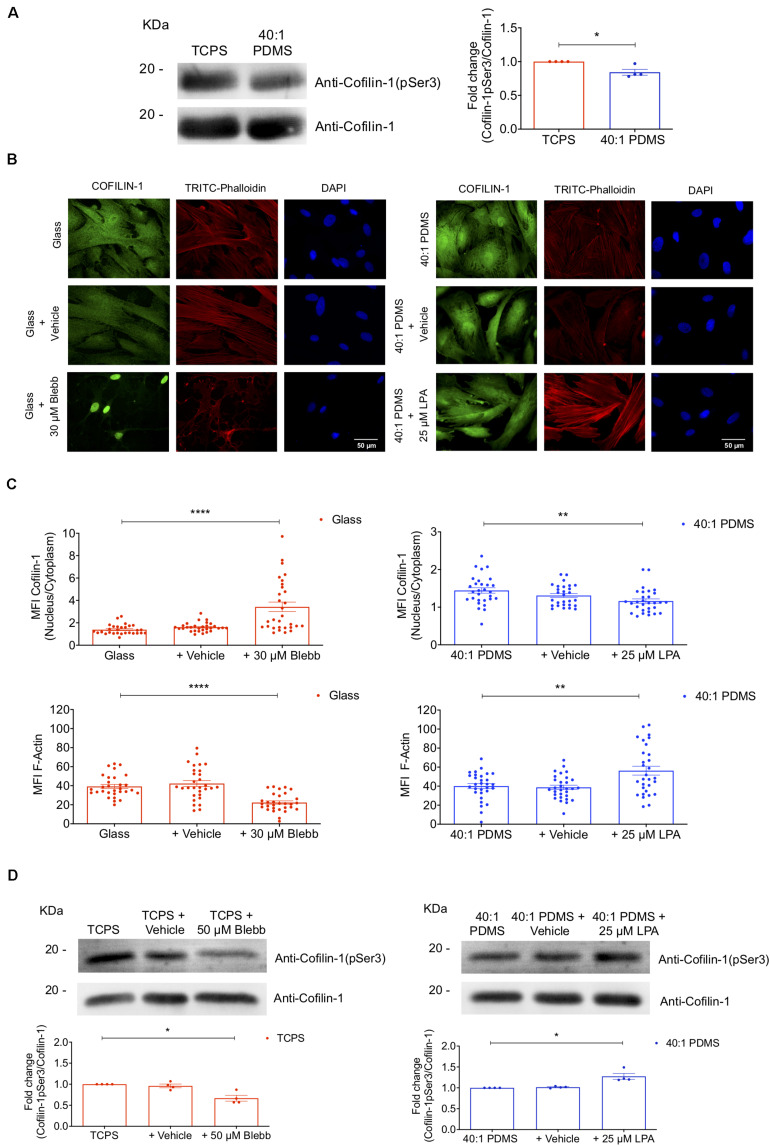
FIGURE 4.
Substrate stiffness and soluble modulators of actomyosin influence Cofilin-1 subcellular localisation and phosphorylation state. (A) Cofilin-1 and phospho-Cofilin-1 (pSer3) levels were evaluated by western blot analysis of whole-cell protein extracts separated by SDS-PAGE (left) obtained from cells cultured on TCPS or 40:1 PDMS between P2 and P4. For the quantification (right) values were normalised by the respective total Cofilin-1 protein level in TCPS or PDMS for each independent experiment. Bars represent the mean of the ratio of Cofilin-1 (pSer3)/total Cofilin-1 ± SEM of four independent experiments. Statistical analysis was performed using One-Sample t-test (theoretical mean of 1.0) with significant differences indicated as *p < 0.05. (B) Representative fluorescence microscopy images and (C) respective MFI quantification of Cofilin-1 nucleus/cytoplasm ratio and F-actin (TRITC-Phalloidin) for cells cultured on glass coverslips or 40:1 PDMS after treatment or not with Blebbistatin or LPA (as indicated). Cells seeded on stiff glass coverslips (left) were cultured for 24 h and then incubated or not with Blebbistatin (30 μM) for an additional 24 h; cells seeded on soft 40:1 PDMS (right) were cultured for 46 h and then incubated or not with LPA (25 μM) for an additional 2 h. In both cases, cells were fixed after 48 h in culture and stained with anti-Cofilin-1 antibody (green), TRITC-Phalloidin for F-actin (red) and DAPI for nuclear counterstaining (blue). Bars represent mean ± SEM of cells analysed from three independent experiments. Statistical analysis was performed using One-Way ANOVA followed by Dunnett’s multiple comparisons test between all conditions (**p < 0.01; ****p < 0.0001). (D) Western blot analyses were performed to detect Cofilin-1 and phospho-Cofilin-1 (pSer3) as described in (A), using whole-cell extracts obtained from cells cultured on stiff TCPS and treated or not with Blebbistatin or cultured on soft 40:1 PDMS and treated or not with LPA (as indicated), with seeding and treatment regimens similar to those described in (B,C). For the quantification (bottom) values were normalised by the respective total Cofilin-1 protein level in TCPS (left) or PDMS (right) for each independent experiment. Bars represent the mean of the ratio of Cofilin-1 (pSer3)/total Cofilin-1 ± SEM of four independent experiments. Statistical analysis was performed using One-Sample t-test (theoretical mean of 1.0) with significant differences indicated as *p < 0.05.

