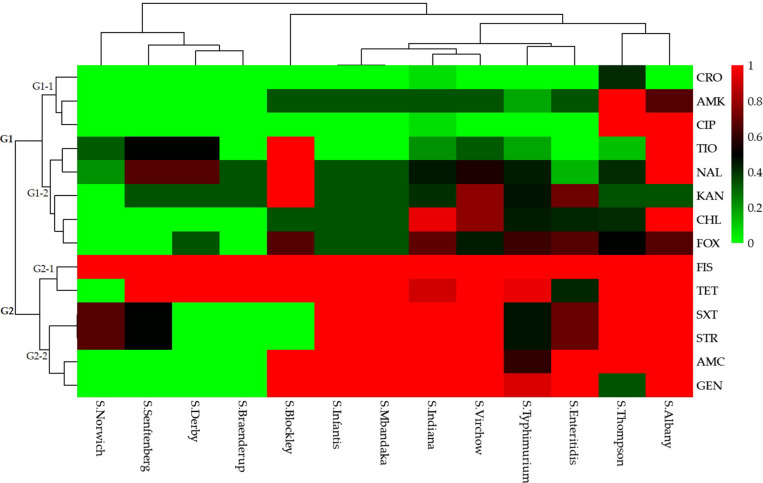
FIGURE 3.
Heatmap (with dendrograms) showing the antibiotic susceptibilities of 61 Salmonella isolates among 13 serotypes. Red squares (pixels) represent high-frequency values and green squares represent low-frequency values. Table 1 presents a list of the abbreviations of the antibiotics.

