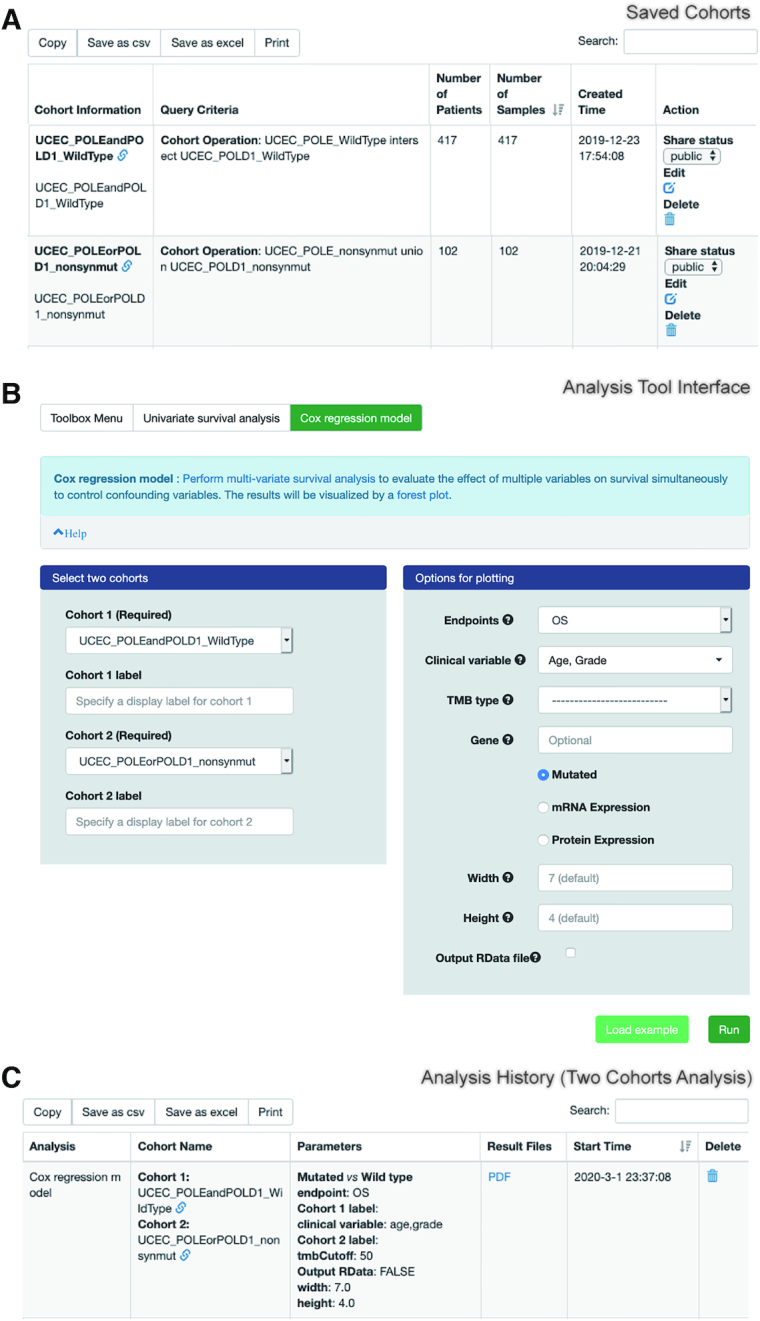
Figure 2.

Key web interfaces of CVCDAP. (A) ‘Saved Cohorts’ shows the name, query criteria, numbers of patients and samples of each created cohort, and provides links to rename, share and remove a selected cohort. (B) Each analysis tool provides a uniform interface for flexible customization of analysis and plotting parameters. (C) ‘Analysis History’ enables users to check the status of analysis task, recall the analysis parameters and download the result files.
