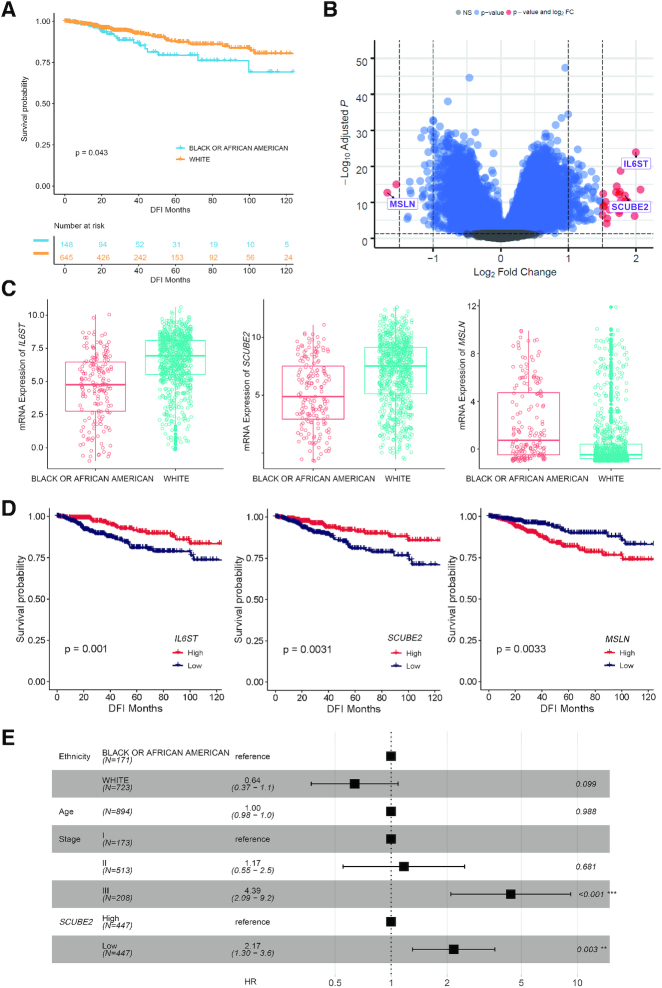
Figure 3.
Molecular profiles associated with ethnic difference in breast cancer recurrence. (A) Kaplan–Meier curve of DFI for 793 stage I-III breast cancer patients in CVCDAP. The analysis was performed using all follow-up events, though we plotted the curves for the first 10 years only. (B) Volcano plot of significance of gene expression difference between African American and white women with breast cancer. A gene is considered to be significantly differentially expressed if |log2(FC)| > 1.5 and adjusted P-value < 0.05. (C) Boxplot of significance of gene expression levels of three candidate genes. IL6ST and SCUBE2 are significantly upregulated, while MSLN is significantly downregulated in white patients compared with African Americans. (D) Kaplan–Meier curve of DFI of three candidate genes. Expression levels of IL6ST, SCUBE2 and MSLN are significantly associated with DFI (P < 0.05). (E) Forest plot shows multivariate HR for tumor recurrence adjusted for ethnicity, age, stage and SCUBE2 expression level. Adjustment for SCUBE2 level decreased the magnitude and significance of the ethnic association with tumor recurrence. Adjusted HRs and their corresponding P values are presented (∗∗∗ indicates P < 0.001; ∗∗ indicates P < 0.01; * indicates P < 0.05; Cox regression). Square data markers indicate estimated HR. Error bars represent 95% CIs. Abbreviations: CI, confidence interval; DFI, disease-free interval; HR, hazard ratios.

