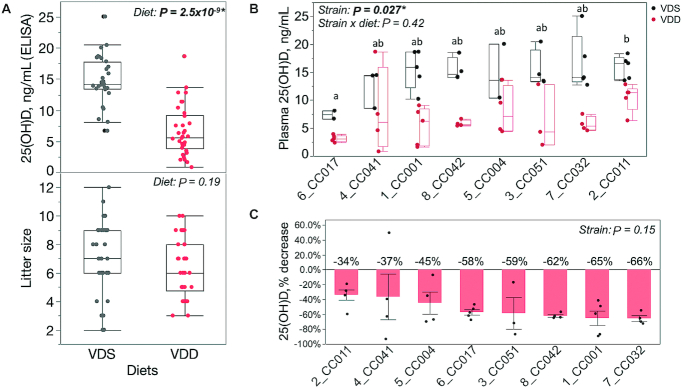
FIGURE 2.
Strain-specific maternal plasma vitamin D status with and without dietary vitamin D depletion. Maternal plasma 25(OH)D concentrations measured by ELISA. (A) Box and whiskers plot of maternal 25(OH)D (top panel) and litter sizes (bottom panel) for each diet (all strains combined). Each dot represents a single female. Main effect of diet P value shown as determined by Wilcoxon test [25(OH)D] or 2-sided t test (litter size). (B) Box and whiskers plot of maternal 25(OH)D concentrations separated by strain. Samples sizes are as follows for VDS and VDD samples for each strain in order from left to right: n = 2,5 (CC017); 3,4 (CC041); 5,5 (CC001); 4,4 (CC042); 3,4 (CC004); 4,3 (CC051); 5,4 (CC032); 5,5 (CC011). x-Axis denotes strain name. Main effect of strain and strain × diet P value shown as determined by linear regression (y = strain + diet + strain × diet). Letters denote strains that differ significantly (a ≠ b = ab) as determined by Tukey's honestly significant difference (HSD) post hoc test. (C) Percentage reduction in maternal plasma 25(OH)D concentration caused by VDD [(VDDSample − VDSMean)/VDSMean], separated by strain. Main effect of strain P value shown as determined by Welch's ANOVA. Mean 25(OH)D percentage reduction values for each strain listed above each bar. Asterisks (*) and bold font indicate statistically significant P values. CC, Collaborative Cross; VDD, vitamin D deficient; VDS, vitamin D sufficient; 25(OH)D, 25-hydroxyvitamin D.

