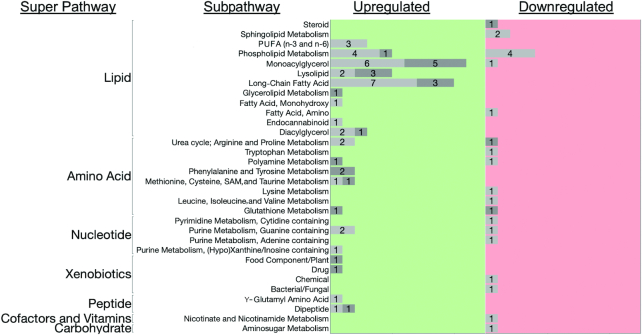
FIGURE 6.
Liver metabolic pathways altered by chronic VDD. Bar graph of the number of liver metabolites altered by VDD for each super- and subpathway. For each metabolic subpathway, the number of affected metabolites are listed in the corresponding bar. Metabolites with <1.5-fold change in concentrations are shown as light gray bars and those with ≥1.5-fold change in concentrations are shown as dark gray bars. Left panel (green) shows number of metabolites that increased with VDD. Right panel (red) shows metabolites that decreased with VDD. VDD, vitamin D deficiency.

