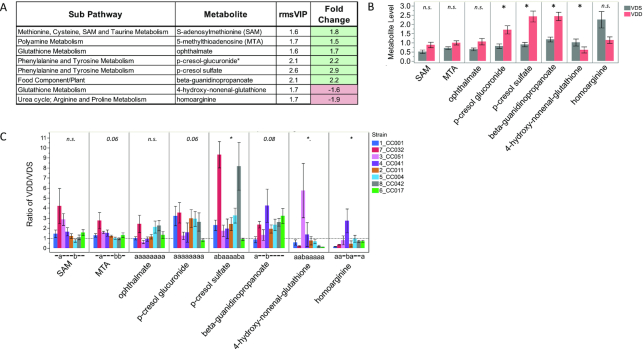
FIGURE 9.
Strain-specific effect of VDD on liver concentrations of putative biomarkers of uremic toxemia. (A) Metabolite names, metabolic subpathways, fold changes, and VIP scores. Green fold change cell indicates increased concentrations in VDD samples compared with VDS. (B) Bar graphs and SEMs of liver concentrations of metabolites by diet. *P < 0.05, determined by Median test. (C) Bar graph of mean change in metabolite concentrations calculated as ratio of VDD/VDS. Dotted line indicates mean metabolite concentrations of VDS samples used as relative control values for calculating VDD response. Mean values above dotted line indicate increased metabolite concentrations in VDD samples compared with VDS; Mean values below dotted line indicate decreased metabolite concentrations in VDD compared with VDS. *Strain effect P < 0.05 as determined by Welch's ANOVA. Letters (a and b) below graphs indicate strains with significantly different VDD-induced fold change in metabolite concentrations compared with other strains in the group as determined by Tukey's honestly significant difference (HSD) post hoc test. CC, Collaborative Cross; MTA, S-methylthioadenosine; n.s., not statistically significant (P > 0.05); rmsVIP, root measure of the orthogonal and predictive variable importance to projection; SAM, S-adenosylmethionine; VDD, vitamin D deficient; VDS, vitamin D sufficient.

