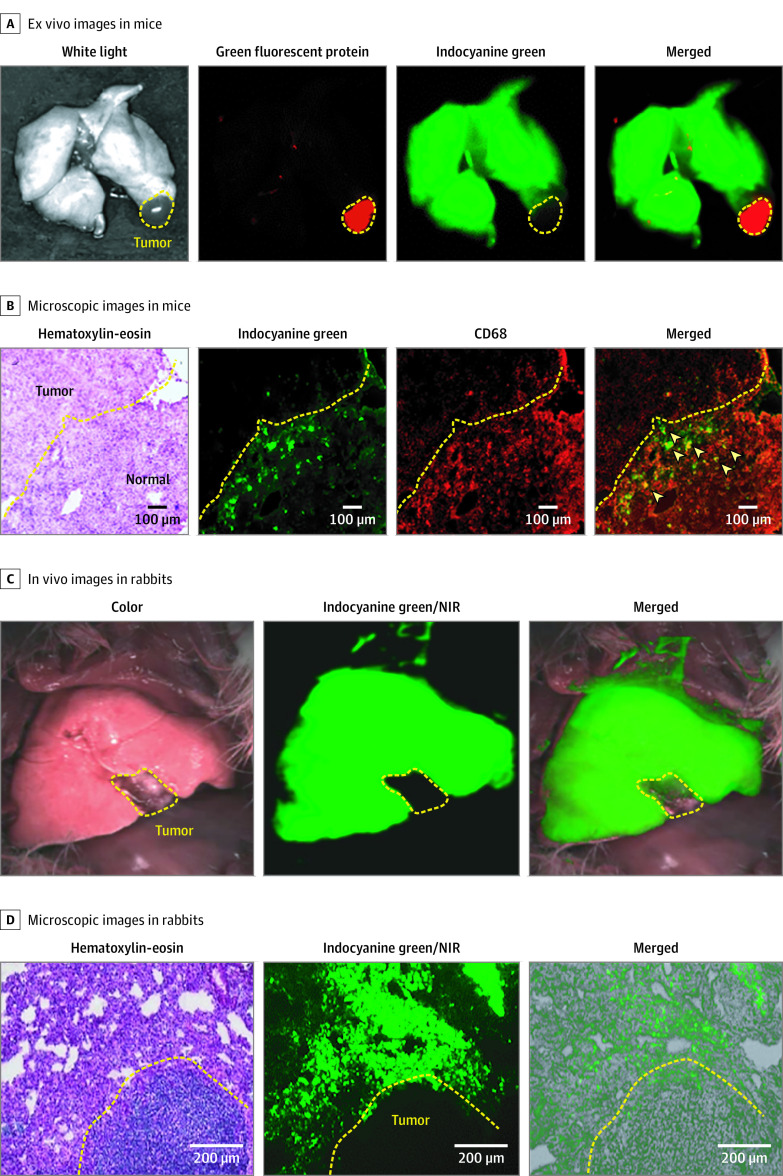
Figure 2. Distribution of Inhaled Indocyanine Green in the Lungs of a Mouse and Rabbit Model With Lung Tumor.
A, Ex vivo images of the lung after indocyanine green inhalation in the mouse lung tumor model. The mouse model was established with Lewis lung carcinoma cell lines that were tagged with green fluorescent protein. The green fluorescent protein signal is represented with red, and the inhaled ICG signal is represented with green. The yellow dotted line indicates the tumor site. B, Microscopic images of the tumor margin with hematoxylin-eosin and CD68 (red) staining in the mouse lung tumor model. The arrowheads in the merged view indicate the alveolar macrophages. C, In vivo lung with bright-field, near-infrared (NIR) (green), and merged images (NIR with bright-field) in the rabbit lung tumor model after indocyanine green inhalation. The yellow dotted line indicates the tumor site. D, Microscopic images of the tumor margin with hematoxylin and eosin staining, NIR fluorescence (green), and NIR fluorescence merged with bright-field in the rabbit lung tumor model after indocyanine green inhalation. The yellow dotted line indicates the tumor site.

