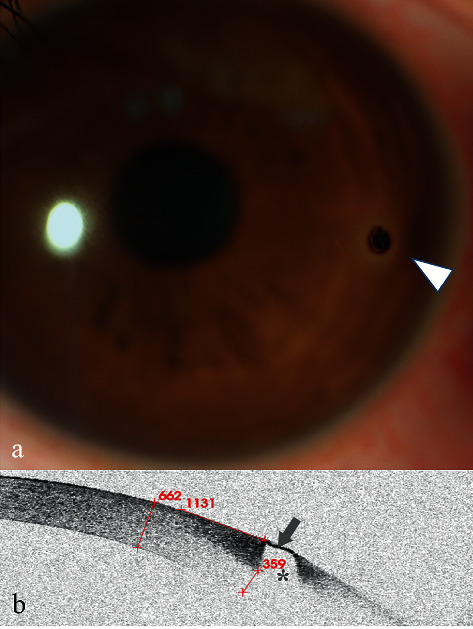
Figure 1.

Anterior segment and AS-OCT image for Case 1. (a) Anterior segment photograph showed a corneal FB and inflammatory infiltration around the FB at an approximately 3:00 o'clock location approaching the limbus (arrowhead). (b) AS-OCT image showed that the FB showed a single high signal with clear boundary (arrow) following a central zone shadowing effect (star). The depth of the FB was estimated indirectly by subtracting the thickness of the underside of the high-reflected signal surrounding a FB (359 m) from the thickness of the cornea (662 m), which was less than 303 μm.
