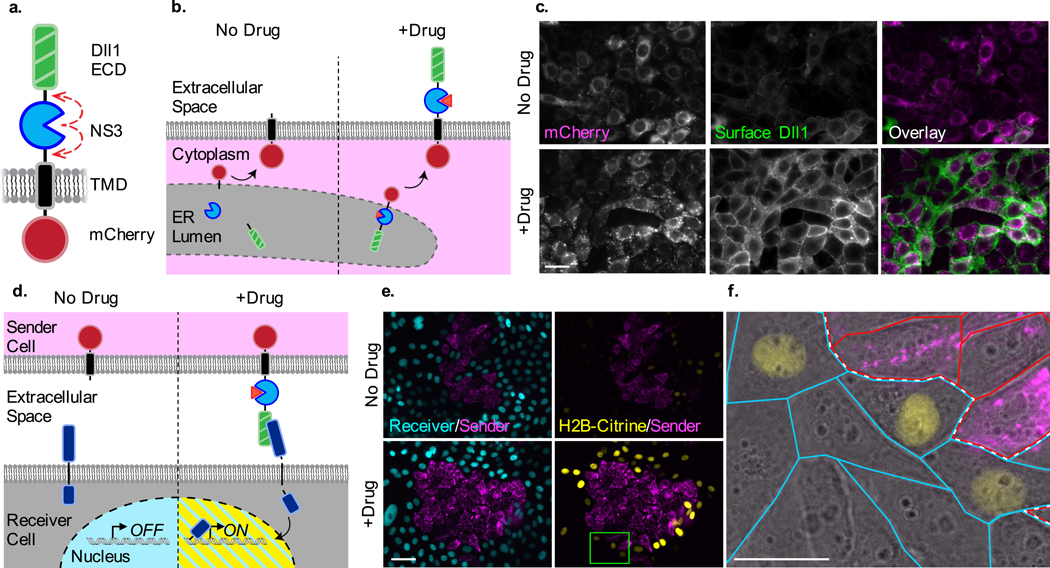
Figure 3. Drug control over ligand presentation and intercellular Notch signaling.
(a) Design of Dll1-NS3-mCherry and (b) schematic of its drug-inducible preservation in response to NS3 inhibition. (c) Immunofluorescent detection of cell-surface localized Dll1-NS3-mCherry in untreated and drug-treated cells (1.5 μM BILN-2061). (d) Schematic depicting the drug-induced activation of Notch “receiver” cells by Dll1-NS3-mCherry expressing “sender” cells in trans. (e) Fluorescence images of cocultured sender and receiver cells in the absence or presence of drug (1.5 μM BILN-2061). Sender cells expressed the DII1-NS3-mCherry ligand (magenta). Receiver cells constitutively expressed H2B-Cerulean (cyan) and human Notch1, and conditionally expressed H2B-Citrine upon Notch activation (yellow). The interface between sender and receiver cell colonies is denoted by the white dotted line. (f) Magnified region from the inset shown in (e) shown as an overlay with transmitted light image. Scale bars are 25 μm.

