Fig. 1.

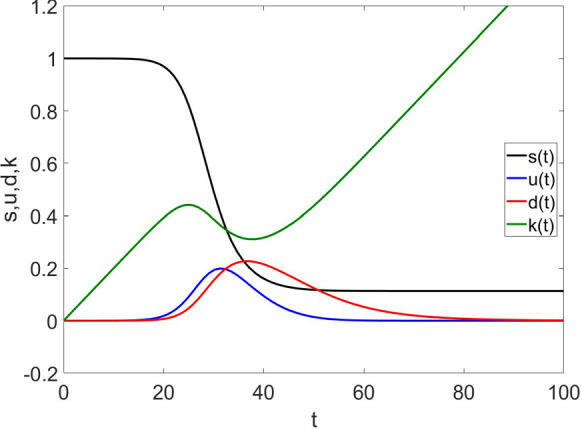
The red line represents the fraction of detected individuals among the population, at different times; blue—undetected; black—susceptible individuals; and green—kits for parameter values , , , , . (Color figure online)

The red line represents the fraction of detected individuals among the population, at different times; blue—undetected; black—susceptible individuals; and green—kits for parameter values , , , , . (Color figure online)