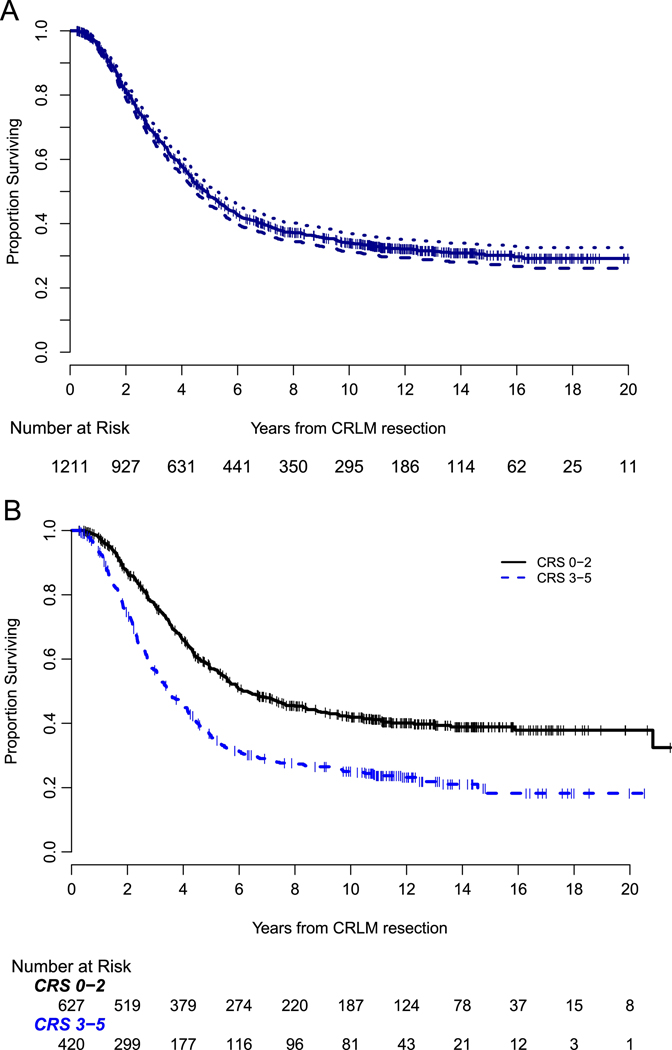
Figure 2.
a. Kaplan-Meier plot of DSS for 1211 patients undergoing resection of CRLM from 1992–2004, 95% confidence interval represented by dotted lines.
b. Kaplan-Meier DSS curve stratified by clinical risk score (CRS, 0–2 vs 3–5). Low CRS (0–2) had a 10-year DSS of 42% (95% CI: 37–46%) compared to 25% (95% CI: 21–29%) for those with a high CRS (3–5) (p < 0.001).

