
Fig. 1. Contrast-enhanced MRI and SE mapping.
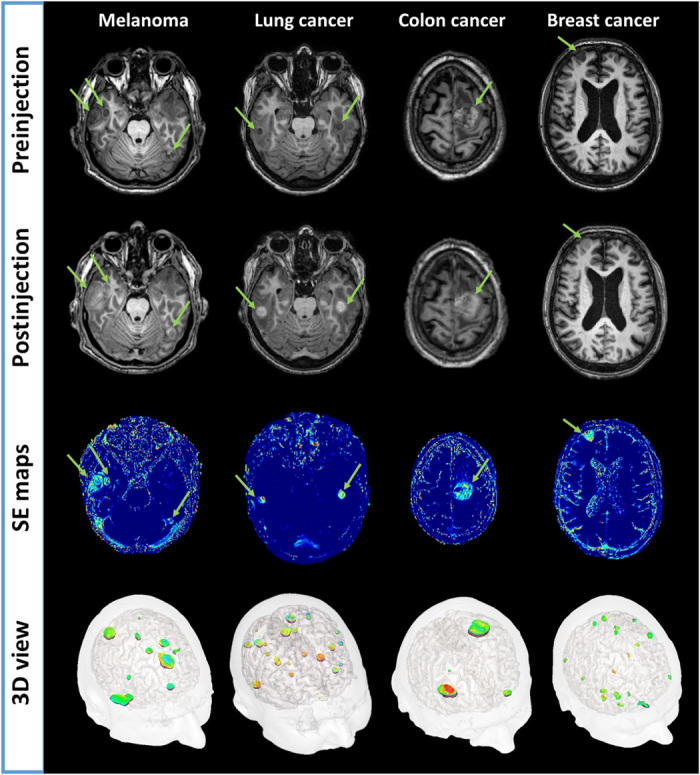
First and second row images are obtained pre/postadministration of Gd-based nanoparticles using three-dimensional (3D) T1-weighted imaging sequence. The green arrows are pointing highlighted metastases. Third row images are corresponding SE maps with conspicuous local increase of intensity (light blue to orange color) in all different types of brain metastases. The fourth row shows a 3D visualization of all metastases with SE.