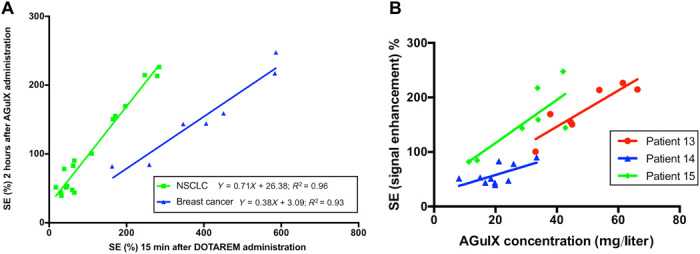
Fig. 3. Comparative enhancement of MRI signal following administration of AGuIX and Dotarem.

(A) Each point corresponds to an MRI SE value measured in a metastasis for patients receiving 100 mg/kg body weight AGuIX dose. The solid lines and the equations correspond to the linear regressions for each primary tumor type (e.g., NSCLC and breast cancer). (B) Correlation between MRI SE and AGuIX concentration following AGuIX administration. Each point corresponds to an MRI SE and AGuIX concentration value measured in a metastasis of patients #13, #14, and #15 injected with a 100 mg/kg body weight AGuIX dose. The solid lines correspond to the linear regression applied to the series of points.
