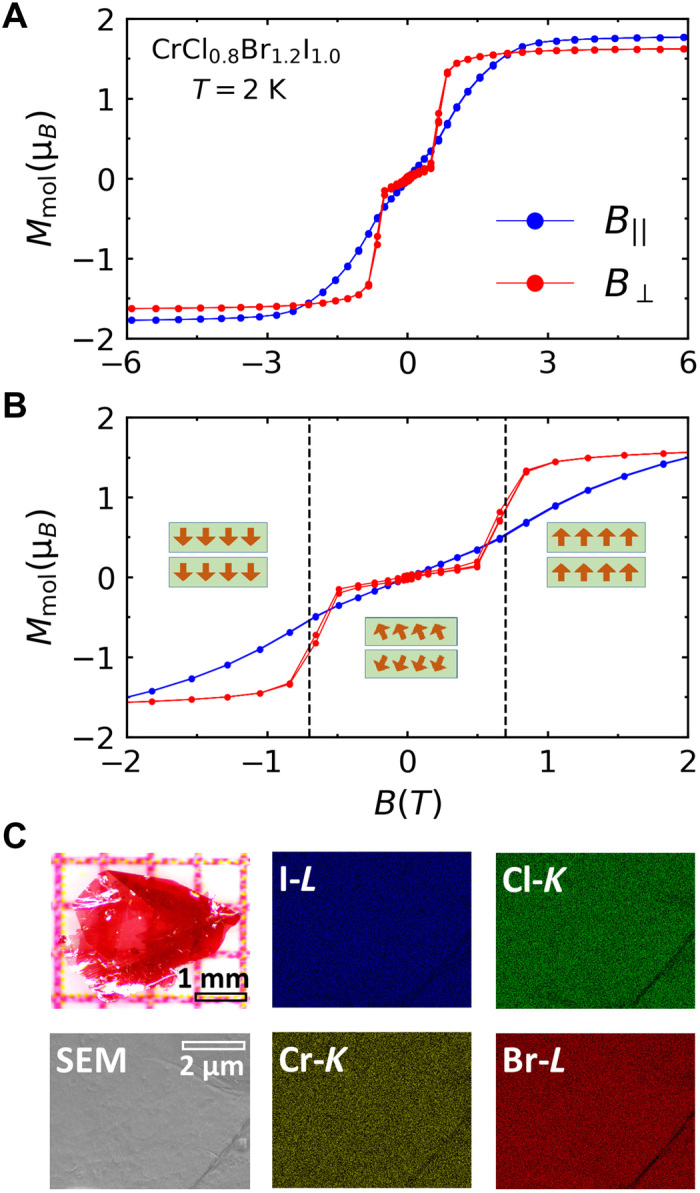
Fig. 6. MM transition in the bulk of VdW alloys.

(A) Magnetization plotted as a function of field in CrCl0.8Br1.2I1.0. The red and blue data correspond to the field perpendicular (B⊥) and parallel (B∥) to the honeycomb layers, respectively. The saturated moment is consistent with S = 3/2 in Cr3+. (B) Magnified view of the spin-canting transition at B⊥ = 0.7 T. (C) Optical image, scanning electron microscope (SEM) image, and energy-dispersive x-ray spectroscopy (EDX) color maps reveal a uniform distribution of Cr (yellow, K-edge), Cl (green, K-edge), Br (red, L-edge), and I (blue, L-edge) in CrCl0.8Br1.2I1.0. Photo credit: F.T., Boston College.
