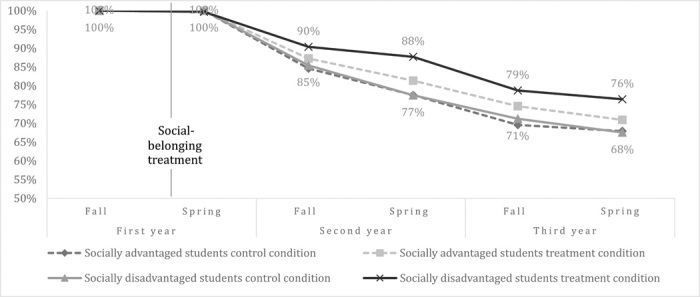
Fig. 1. Percentage of students who maintained continuous enrollment over 2 years after intervention by term, student group, and condition.

Note: Percentages are unadjusted for baseline covariates. Sample size by group and condition: socially advantaged students, control condition (N = 243); socially advantaged students, treatment condition (N = 226); socially disadvantaged students, control condition (N = 299); socially disadvantaged students, treatment condition (N = 295).
