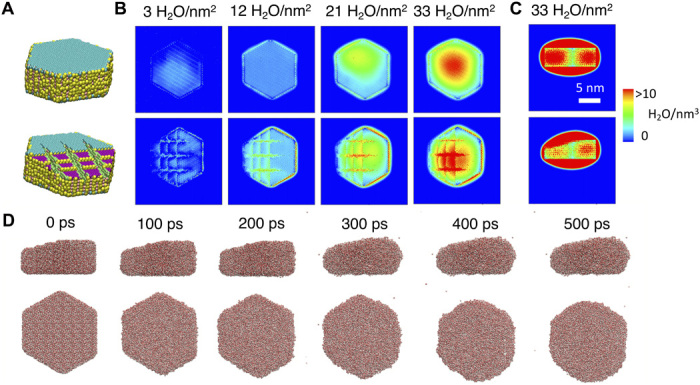
Fig. 5. MD show that the surface tension of water and mineral defects drive the anisotropic distribution of water on gibbsite nanoparticles.

Simulations of 11.2 nm–by–13.4 nm–by–4.7 nm (A) pristine and roughened gibbsite particles covered in water films (3 to 33 H2O/nm2). Hydroxyl groups on different crystallographic faces and defect zones are color-coded. Water density (H2O/nm3) maps of the (B) (001) face (C) particle edge were generated from production run of at least 5000 ps performed at a time step of 0.5 fs in an NVT ensemble at 300 K. (D) Morphology of a film with 33 H2O/nm2 on the roughened particle [top row edge faces view; bottom row (001) face view] at selected simulation time. Films departed from the initial gibbsite morphology to decrease the total surface area, a means to minimize the surface energy (see fig. S15). This effectively increases water loadings over the central parts of the faces and depletes them at the edges. Simulations with roughened particles in the form of three 0.5-nm-thick steps and three grooves up to 1.0 nm deep revealed preferential water uptake to the defect sites first at low water loadings.
