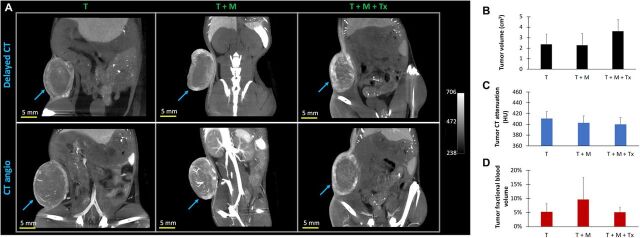
Fig. 3. Nanoparticle contrast–enhanced CT imaging.
(A) Representative thick slab coronal images of mouse lower abdomen showing tumor signal enhancement on delayed CT image (top row) and CT angio image (bottom row) for an animal in the tumor-only control group (T, left column), tumor + MDSC untreated group (T + M, middle column), and tumor + MDSC + NK cell immunotherapy group (T + M + Tx, right column). Delayed CT images were acquired 4 days after administration of nanoparticle contrast agent. Immediately thereafter, a second dose of nanoparticle contrast agent was injected to acquire CT angiography within an hour after contrast administration. (B) CT-derived tumor volume, (C) CT-derived mean tumor attenuation [Hounsfield units (HU)], from delayed CT scan due to accumulation of nanoparticle contrast agent, an indicator of tumor vascular permeability and tumor leakiness, and (D) CT-derived mean tumor fractional blood volume, an indicator of tumor vascularity, in tumors alone (T), tumor inoculated with human MDSCs (T + M), and tumors with MDSCs after NK cell therapy (T + M + Tx). CT-derived global tumor metrics did not show significant group differences (P > 0.05). Data are presented as means ± SD (n = 9 to 10 animals per group).

