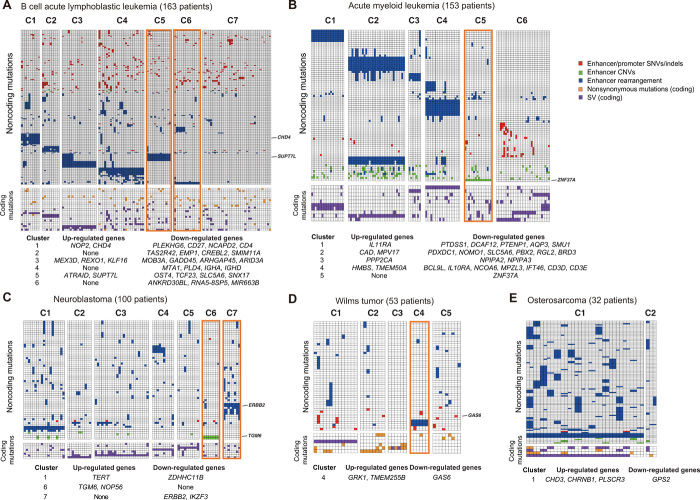
Fig. 6. Integrative mutation profiles of pediatric cancers.
(A to E) Mutation profiles of patients with B-ALL, AML, NBL, WT, and OS. Heat maps were generated using recurrently mutated genes (due to either coding or noncoding mutations) in at least five patients. Patients are clustered according to the combined coding and noncoding mutation profiles. The color of each cell indicates the class of mutations. Rows, genes; columns, patients. For presentation purposes, the heat maps are divided into submaps based on noncoding (top) or coding mutations (bottom). The tables below the heat maps list up- or down-regulated genes due to noncoding mutations in all patients in a given cluster. Clusters discussed in the text are highlighted in orange boxes. Mutations and affected genes discussed in the text are indicated on the right edge of each heat map.

