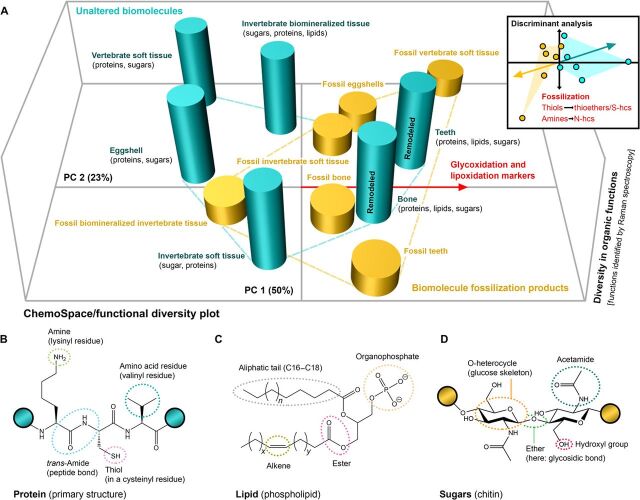
Fig. 1. Changes in the molecular composition of animal tissues through geologic time.
(A) ChemoSpace PCA and discriminant analysis (DA) of in situ Raman spectra of modern and fossil animal samples (n = 96) averaged by individual tissue types (band set 1). PC 1 and PC 2 define a principal component space on which a measure of functional diversity {z axis} is plotted for each modern and fossil animal tissue type (see Materials and Methods). Blue columns represent unaltered biomolecules in modern tissues (corresponding to the blue convex hull), and orange columns represent biomolecular fossilization products in fossil tissues (orange convex hull). Modern tissues remodeled in vivo are labeled. The functional diversity of structural biomolecules in modern tissues is high, whereas that in different fossil tissues is much lower. The red vector arrow indicates the general trajectory [recovered in PCA (Principal Component Analysis) and DA] in molecular composition followed by samples during fossilization and identifies the processes of glycoxidation and lipoxidation. (B to D) Structural biomolecules in modern tissues with labeled functional groups. (B) Protein, a tripeptide with the amino acids lysine, cysteine, and valine. (C) Lipid. (D) Sugar (the glycosaminoglycan chitin). The colored circles indicate extensions of the biopolymer.

