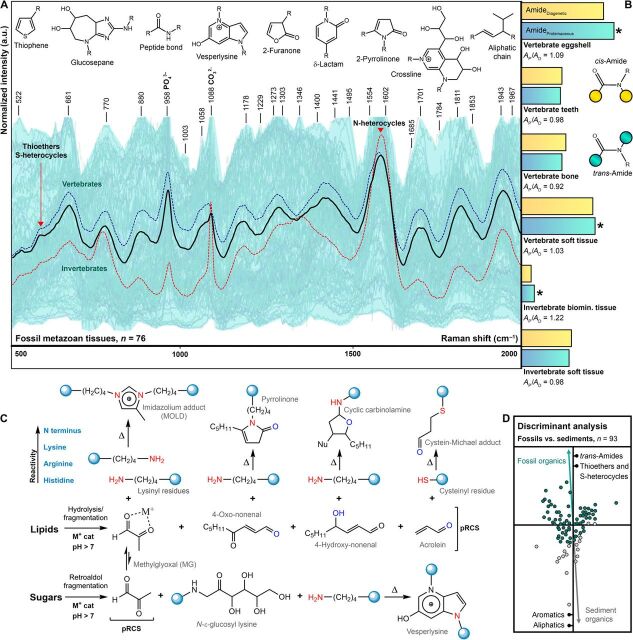
Fig. 2. High-resolution in situ Raman spectra of fossil animal tissues and assessment of their diagenetic alteration.
(A) Plot of Raman spectra of fossil metazoans in light blue; averaged spectra: black, all fossil metazoans (n = 76); dotted blue, vertebrates (n = 41); and dotted red, invertebrates (n = 35). Red arrows: advanced lipoxidation/glycoxidation end products ALEs/AGEs; R, variable residues. Units evident in fossil tissues are displayed at the top. (B) Bar charts, averaged for tissue type (Supplementary Data), show normalized signal intensities at 1685 cm−1: blue, trans-amide, peptide bond (Ap); and at 1701 cm−1: yellow, cis-amide, diagenetically formed (Ad). Ratios (Ap/Ad) are based on these signals. Asterisks, pristine preservation of the protein/PFP phase: Ap/Ad > 1. Yellow/blue circles, extension of the polymer. (C) Molecular mechanisms for the transformation of structural biomolecules during fossilization. Cat, catalyst; Nu, nucleophile; pRCS, primary RCS; Δ, thermal energy input. Blue circles, extension of the polymer. (D) Discriminant analysis of organic matter in fossil animal tissues (n = 76; green dots) and sediments (n = 17; gray dots) based on Raman intensities at 24 band positions (Supplementary Data). Green/gray arrows, trajectory of fossil/sediment samples. Discriminant factors are listed. a.u., arbitrary units.

