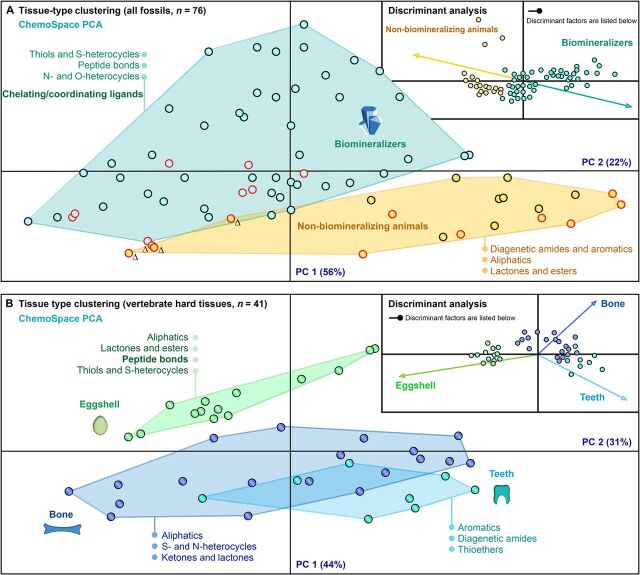
Fig. 3. Clustering of fossil animal tissues.
(A) Biomineralization signal for all metazoan fossils based on spectral intensities at 24 Raman band positions (n = 76) (see Materials and Methods) complemented by a discriminant analysis of the biomineralized (n = 56, blue dots) and non-biomineralized (n = 20, yellow dots) samples, based on the same Raman data. Black outlined dots, vertebrate samples (generally more ALEs, compare Table 1); red outlined, invertebrate samples (generally fewer ALEs than AGEs, compare Table 1); Δ, thermally matured samples (Cambrian Burgess Shale); blue arrow, trajectory of biomineralized tissues; yellow arrow, that of no-nbiomineralized tissues. (B) Tissue-type signal. Data on vertebrate eggshells (n = 14), bones (n = 19), and teeth excluding conodonts (n = 8) from the data set used in (A) were subjected to a discriminant analysis. Green, eggshells; dark blue, bones; and light blue, teeth.

