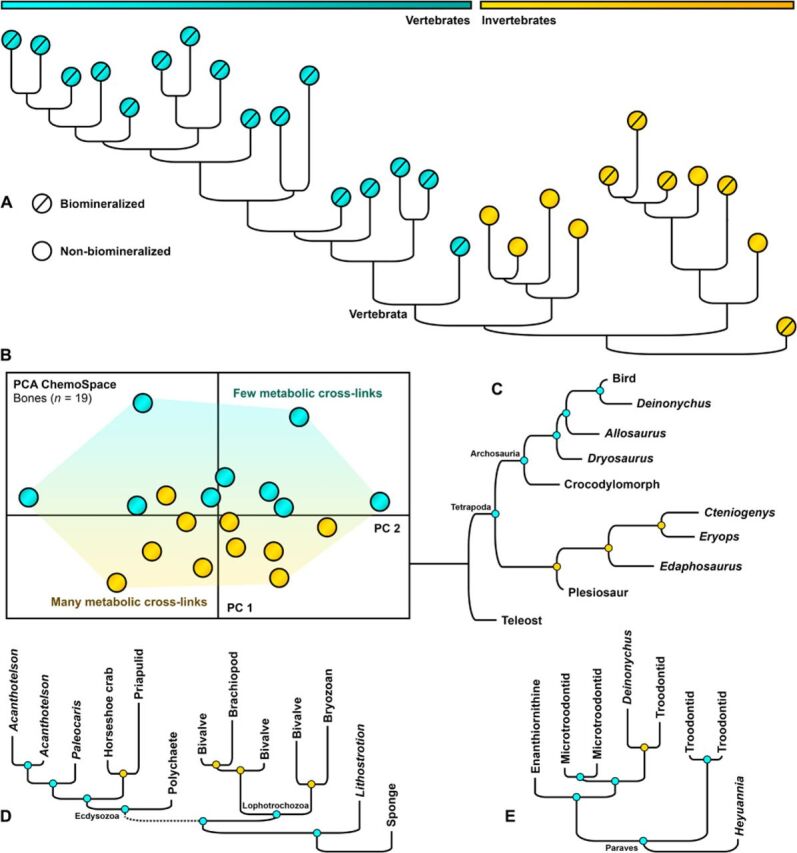
Fig. 4. Assessment of the phylogenetic signal preserved in fossils.

Hierarchical cluster analysis of metazoan fossils based on Raman intensities at 20 band positions characterizing the specific composition of N– and S–cross-links (n = 37); vertebrate fossil soft tissues are not included (see Materials and Methods). Samples in each cluster are selected by tissue type. Node colors: blue, correct; orange, incorrect solution (Supplementary Data, Specimen Data). The topology calculated from fossil tooth spectra can be found in the Supplementary Data. (A) Cross-tissue–type cluster analysis of phylogenetic signals (Materials and Methods). Orange dots, invertebrates; blue dots, vertebrates. (B) Vascularized bone (n = 19, samples as in Fig. 3B) in a PCA ChemoSpace based on the abundance of in vivo metabolic cross-links. Blue dots, metabolic rate <1 ml O2 hour−1 g−0.67; orange dots, metabolic rate >1 ml O2 hour−1 g−0.67. (C) Fossil bones: Correspondence with published consensus trees is 62%. (D) Biomineralized and non-biomineralized invertebrate tissues (clusters determined independently and combined): Correspondence is 75% and 40%, respectively; even derived nodes are accurately resolved (Crustacea in Ecdysozoa). (E) Fossil eggshells: Correspondence is 83%.
