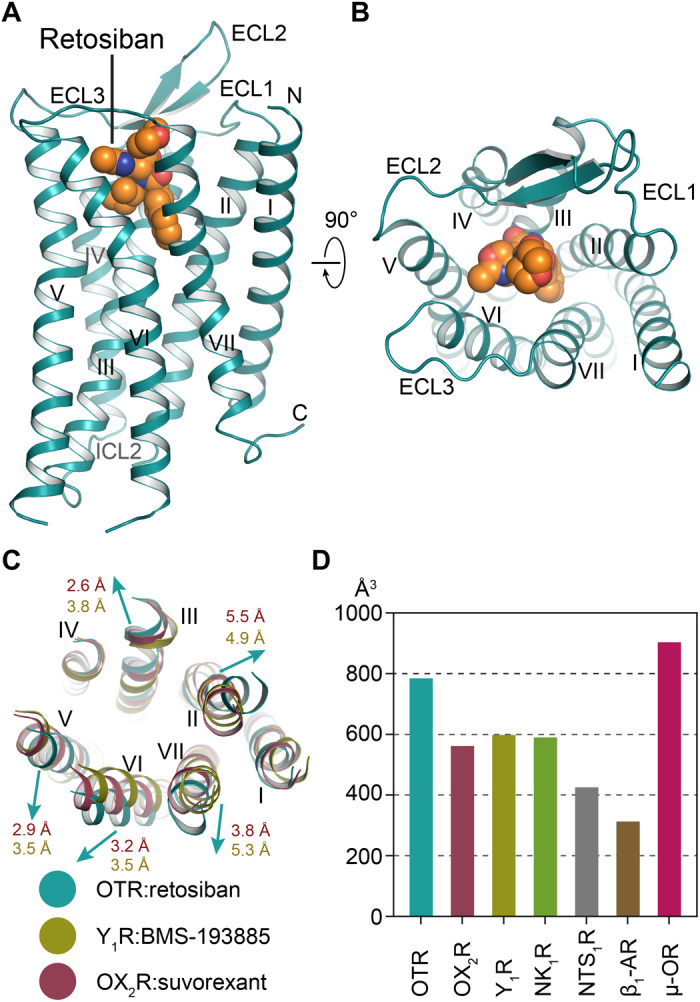
Fig. 1. Overall structure of retosiban-bound OTR.

(A) OTR (turquoise) in complex with retosiban (orange) viewed parallel to the membrane plane. OTR is depicted as ribbon, and retosiban is shown in sphere representation, with oxygen and nitrogen atoms highlighted in red and blue, respectively. (B) OTR:retosiban complex as viewed from the extracellular space. (C) Structural superposition of OTR with Y1R (yellow; PDB ID: 5ZBH) and OX2R (raspberry; PDB ID: 4S0V). Arrows indicate shifts of the OTR extracellular helix tips relative to the reference receptors. Helix tip movement in Å is indicated in the respective receptor colors (raspberry and yellow, respectively). (D) Calculated extracellular ligand-binding pocket volumes of selected neuropeptide GPCRs and one adrenergic receptor (β1-AR).
