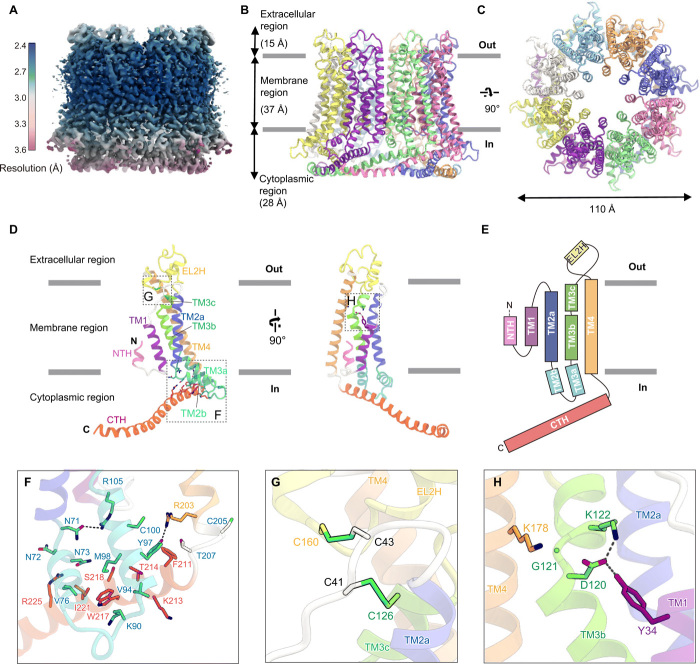
Fig. 1. Overall structure of OlCALHM1.
(A) Local resolution of the OlCALHM1EM structure, estimated by RELION. (B and C) Overall structure of the OlCALHM1EM octamer, viewed parallel to the membrane (B) and from the extracellular side (C). (D) Subunit structure of OlCALHM1EM, viewed parallel to the membrane. Each region is colored as follows: NTH, pink; TM1, purple; EL1, white; TM2a, light blue; TM2b, IL1, and TM3a, cyan; TM3b and 3c, light green; EL2, yellow; TM4, orange; CTH, red. The N and C termini are indicated by “N” and “C,” respectively. (E) Schematic representation of the OlCALHM1 membrane topology, colored as in (D). (F to H) Close-up views of the intracellular side (F), the two disulfide bonds in the extracellular region (G), and the interactions between TM1 and the other TMs around Asp120 (H).

