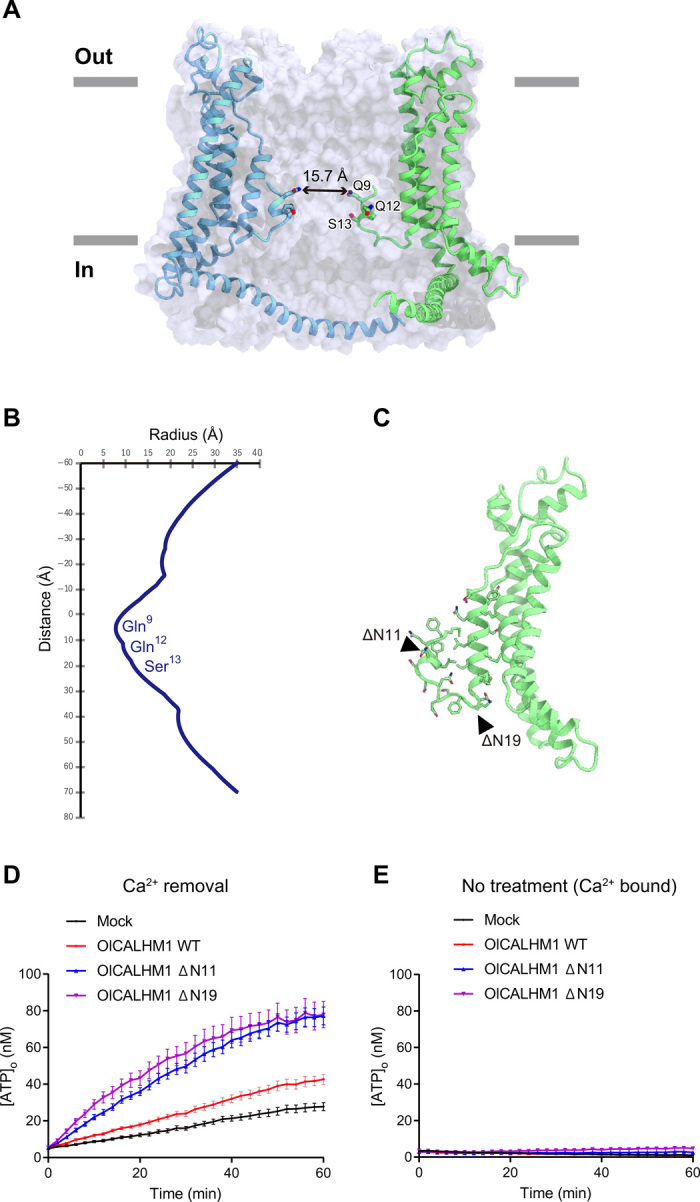
Fig. 3. Pore architecture and ATP conduction of OlCALHM1.

(A) Cross sections of the surface representation for the OlCALHM1EM subunits, showing the ion channel pore. (B) Pore radius for the OlCALHM1EM structure along the pore center axis. The pore size was calculated with the program HOLE (38). (C) Design of the ΔNTH constructs. The residues in the NTH and the loop between NTH and TM1 are shown as stick models. (D and E) Time courses of extracellular ATP levels due to release from HeLa cells transfected with the empty vector (mock), WT OlCALHM1, or NTH-truncated (ΔN11 or ΔN19) OlCALHM1 following exposure to essentially zero (17 nM) (D) or normal (1.9 mM) [Ca2+]o (E). Data are displayed as means ± SEM. n = 15 (mock), n = 16 (WT, ΔN11, and ΔN19) in (D). n = 16 in each group in (E).
