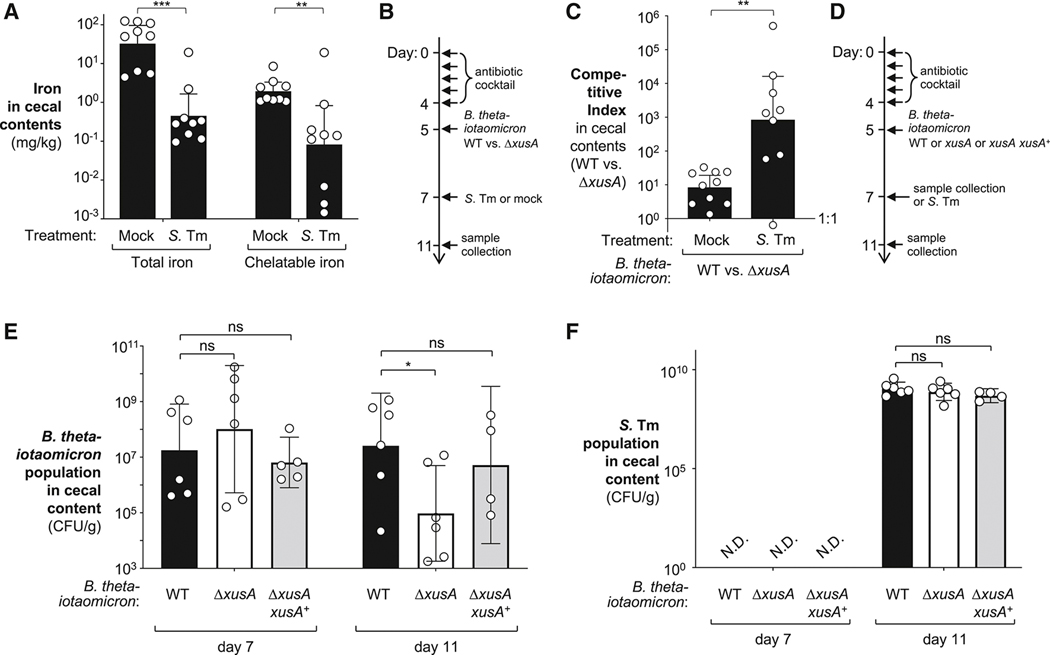
Figure 4: Role of xusABC locus in B. thetaiotaomicron colonization during murine S. Tm infection.
(A) Groups of streptomycin-treated C57BL/6 mice were either mock-treated (N = 9) or intragastrically inoculated with S. Tm SL1344 (N = 9). Four days after infection, the cecal contents were collected and separated into the chelatable and inaccessible iron fraction. The iron concentration was determined by ICP-MS. (B – C) Groups of C57BL/6 mice were treated with a cocktail of antibiotics, followed by intragastrical inoculation of an equal mixture of B. thetaiotaomicron wild-type strain (genomic signature tag 3; WZ433) and a xusA mutant (genomic signature tag 13; WZ647). Mice were mock-treated (LB, N = 10) or challenged with S. Tm SL1344 (N = 9) for 4 days. The abundance of each B. thetaiotaomicron strain in cecal contents was determined using qPCR targeting strain-specific signature tags. The competitive index was calculated as the ratio of the two strains in the cecal content, corrected by the ratio in the inoculum. A schematic representation of the experiment is shown in (B). Competitive index of B. thetaiotaomicron wild-type over xusA mutant in cecal contents (C). (D – F) Groups of C57BL/6 mice were treated with a cocktail of antibiotics, followed by intragastrical inoculation of either the B. thetaiotaomicron wild-type strain (Δtdk, GenR; N = 12), an isogenic xusA mutant (WZ777, GenR CmR, N = 12), or a complemented xusA mutant (WZ675, xusA xusA+, N = 9). After two days, half of the animals in each group were euthanized to assess the colonization levels of these strains at homeostatic conditions, while the remaining groups were challenged with S. Tm SL1344 for 4 days. A schematic representation of the experiment is shown in (D). Abundance of indicated B. thetaiotaomicron (E) and S. Tm (F) strains in cecal contents as determined by plating on selective agar. See also Fig. S4–6. Bars represent the geometric mean ± 95% confidence interval. *, P < 0.05; **, P < 0.01; ***; P < 0.001; ns, not statistically significant.

