Figure 3.
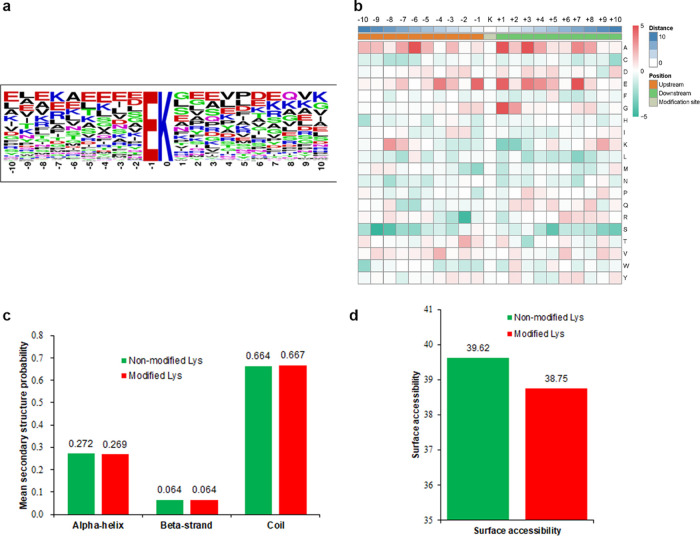
Properties of the Kub sites. (a) Sequence probability logos of significantly enriched ubiquitination motifs around the Kub sites. (b) Heat map of amino acid compositions showing the frequency of different types of amino acids around the lysine ubiquitination sites. Capital letters on the right side of the figure represent amino acid abbreviations. Red indicates enrichment, while green indicates depletion. (c) Distribution of secondary structures containing Kub sites. (d) Predicted surface accessibility of ubiquitinated sites.

