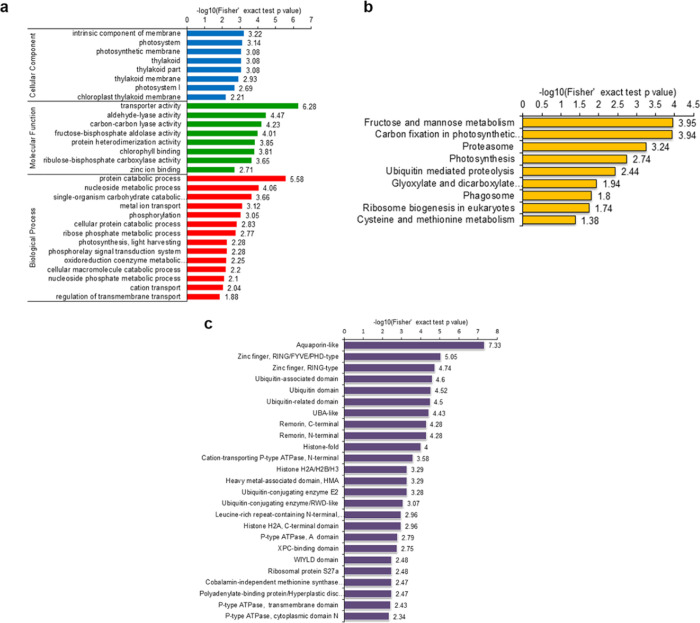
Figure 5.
Enrichment analysis of ubiquitinated proteins. (a) GO-based enrichment analysis in terms of biological process (red bars), molecular function (green bars), and cell component (blue bars). (b) KEGG pathway-based enrichment analysis. (c) Protein domain enrichment analysis. The numbers on the X axes represent significant values. Data were considered statistically significant when the value was greater than 1.3 and p-value <0.05.

