Figure 6.
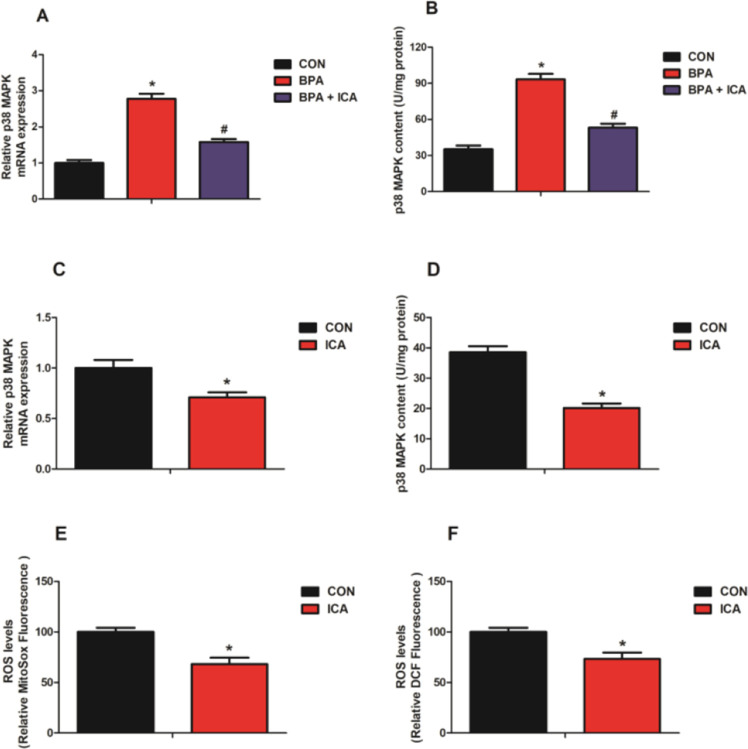
Effect of ICA on p38 MAPK expression and oxidative stress in MODE-K cells with BPA challenge. The gene expression (A) and content (B) of p38 MAPK in MODE-K cells. The gene expression (C) and content (D) of p38 MAPK in MODE-K cells. Changes in the levels of (E) mitochondrial ROS (MitoSox dye oxidation) and (F) total intracellular ROS (H2DCF oxidation) in MODE-K cells. Values are the mean ± standard error (n = 6). *p < 0.05 vs CON group; #p < 0.05 vs BPA group.

