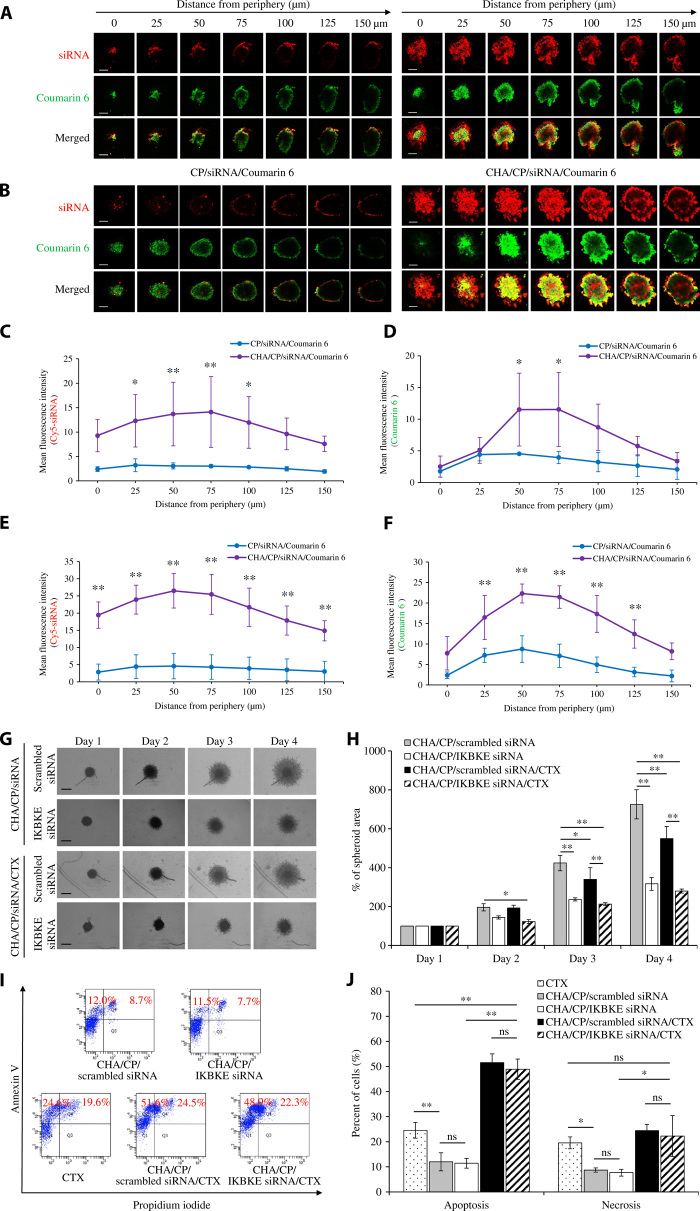
Fig. 5. 3D tumor spheroid penetration, invasion, and apoptosis study of the HA-modified siRNA nanocomplex.
Representative z-stack confocal images of the spheroids with a z-step of 25 μm for CP/Cy5-siRNA/Coumarin 6 and CHA/CP/Cy5-siRNA/Coumarin 6 nanocomplexes after 1 hour (A) and 2 hours (B) of incubation. Red for Cy5-siRNA, green for Coumarin 6, and yellow for merged area. Scale bars, 200 μm. Mean fluorescence intensity of Cy5-siRNA after 1 hour (C) and 2 hours (E) of incubation and Coumarin 6 after 1 hour (D) and 2 hours (F) of incubation in the z-stacked confocal images versus the distance from the periphery of the spheroids (n = 3). (G) Representative images of 3D spheroid invasion of MDA-MB-231 cells (n = 3). Scale bars, 500 μm. (H) Quantification of spheroid invasion based on the change of the total areas of the spheroids. The spheroid areas of each day were normalized to the areas measured at day 1. The data are presented as means ± SD (n = 3). (I) Apoptosis study of the cells using the Alexa Fluor 488 Annexin V/Dead Cell Apoptosis Kit and flow cytometry. (J) Percentage of apoptotic and necrotic cells after 48 hours of transfection. All results are presented as means ± SD (n = 3). *P < 0.05; **P < 0.01; ns, not significant. CP, cholesterol-peptide; CHA, cholesteryl-HA; cabazitaxel, CTX.

