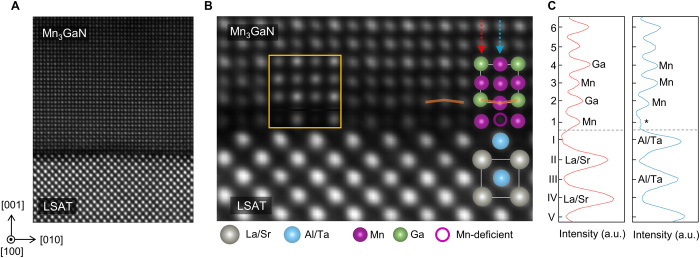
Fig. 3. HAADF-STEM characterization of the Mn3GaN/LSAT heterointerface.
(A) High-angle annular dark-field (HAADF)–STEM imaging of the Mn3GaN/LSAT heterostructure taken along the [100] zone axes of LSAT. (B) Magnified HAADF-STEM imaging overlaid with the cation positions and simulated image of the interface (yellow square). Orange lines are a guide to the eyes, showing buckling of the Mn and Ga atoms at the second row. (C) Integrated HAADF-STEM intensity line profile along two adjacent atomic columns [out-of-plane direction, represented by arrows in (B)]. Ordinate y axis shows the layer’s number, denoted by roman numerals for LSAT and Arabic numerals for Mn3GaN. Since the HAADF-STEM intensity is proportional to Z2 (Z, atomic number), Ga atoms show higher intensity than Mn atoms. The * symbol indicates Mn deficiency.

