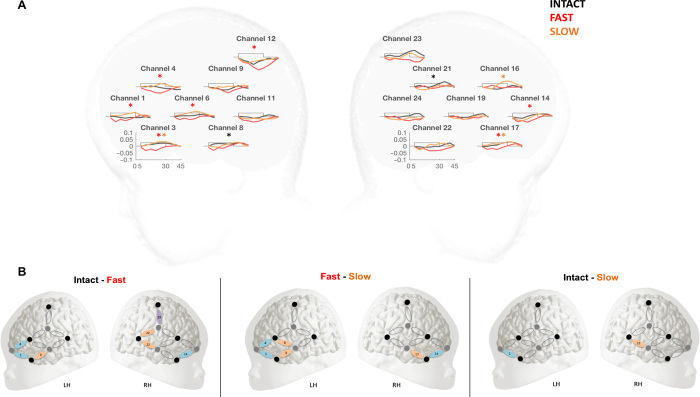
Fig. 4. Variations in oxyHb.
(A) OxyHb concentration changes over stimulation blocks in each channel and in each hemisphere. The x axis represents time in seconds, and the y axis represents concentration in millimole-millimeter. The rectangle along the x axis indicates time of stimulation. The black lines represent the concentration for the Intact condition, the red for the Fast condition, and the orange for the Slow condition. Color-coded * represents the channels differing from baseline for each condition (P < 0.05). (B) Condition-by-condition comparisons of the significantly activated channels according to permutation test (P < 0.05).

