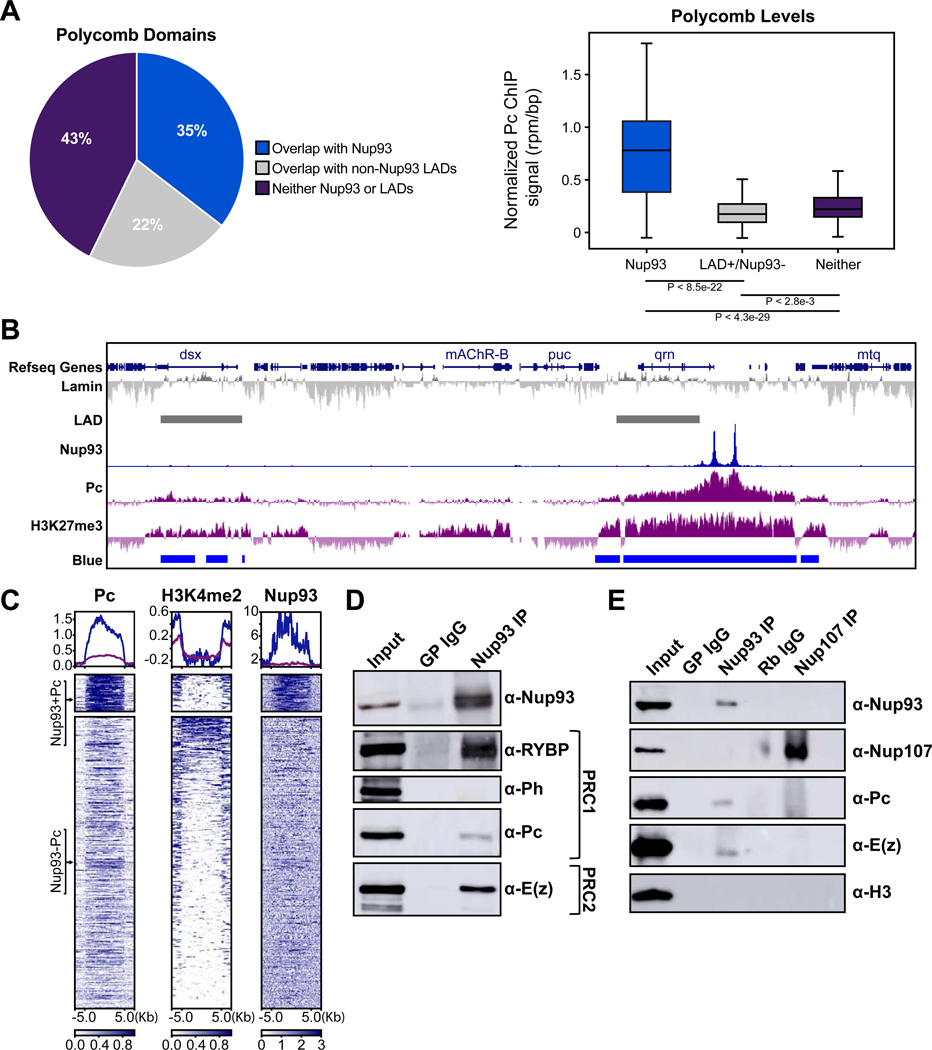
Figure 4. Nup93 interacts with high-occupancy Polycomb domains and select PRC components.
(A) Percent Pc binding domains (defined by published Pc ChIP-seq and chromatin color models), which either contain Nup93 ChIP-seq peaks (blue), or LADs but no Nup93 ChIP-seq peaks (grey), or contain neither (purple) (left). Averaged Pc ChIP-seq signal intensities among these three groups are plotted on the right. P-values were calculated using two-tailed nonparametric t test. (B) Representative GB snapshot (360 Kb) with Nup93, Elys, Nup107, Pc, and H3K27me3 ChIP-seq and chromatin colors at Nup93-containing Pc domains (right) or Pc without Nup93 domains (left). (C) Enrichment heat maps of ChIP-seq peaks of Pc, relative to Nup93 and H3K4Me2, classified into two main clusters - Nup93-containing (top) and non-Nup93-containing (bottom), sorted by Pc peak intensity (rpm/bp) and aligned by their distance from the peak along the genome (Kb). Note the relative absence of H3K4Me2 signal in Nup93-containing Pc cluster. (D) Western blot analysis of Nup93 Co-IPs from protein extracts of S2 cells against components of PRC1 and PRC2. (E) Western blot analysis of Nup93 and Nup107 Co-IPs on S2 cell protein extracts against Nups, components of PRC1, PRC2 and H3 histones. See also Figure S4.

