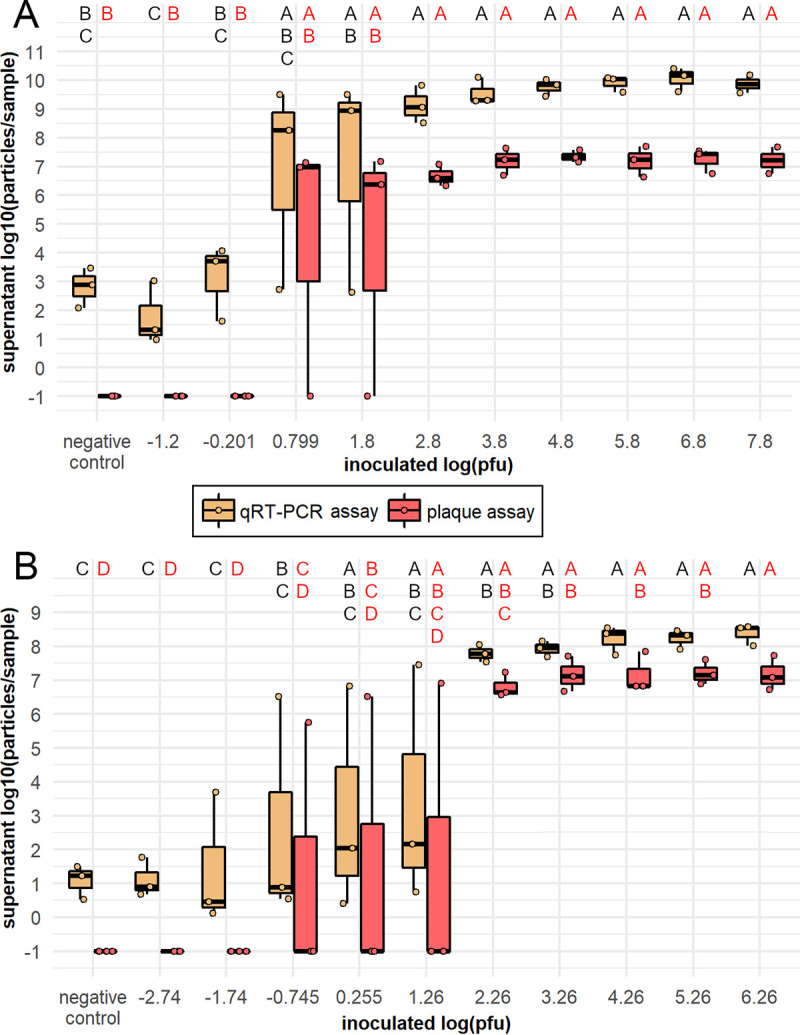
FIG 1.

Infectious range of frozen ZIKV-Cambodia and ZIKV-Paraiba stocks in vitro. ZIKV Cambodia (A) and Paraiba (B) titers in C6/36 cell supernatants at 6 days post-inoculation with ZIKV stock at titers corresponding to qRT-PCR standard curve dilutions, or negative media control, displayed as log10 (particles/sample), measured by qRT-PCR (in log10 [p-e/sample]) and plaque assay (in log10 [PFU/sample + 0.1]). Titers are presented as ● symbols, and the boxplots indicate median titers and interquartile ranges. Results are from N = 2 to 3 and N = 3 independent biological replicates for ZIKV-Cambodia (A) and ZIKV-Paraiba (B), respectively. ZIKV titers were analyzed by ANOVA using the following model for ZIKV-Cambodia assayed by qRT-PCR and plaque assay and ZIKV-Paraiba assayed by qRT-PCR: Yij = μ + inoculum titerj; and using the following model for ZIKV-Paraiba assayed by plaque assay: Yijk = μ + inoculum titerj + replicatek. Inoculum titer was a highly significant predictor of supernatant titer when assayed by qRT-PCR (ZIKV-Cambodia, P = 16.27E−06; ZIKV-Paraiba, P = 1.58E−05) or plaque assay (ZIKV-Cambodia, P = 8.94E−06; ZIKV-Paraiba, P = 7.21E−06), and this effect varied by replicate for ZIKV-Paraiba assayed by plaque assay (P = 0.029). The assumption of normality was violated in these analyses. Uppercase letters indicate significant differences between groups (P < 0.05) as determined by Tukey’s HSD post hoc analysis, with letters in black indicating comparisons between qRT-PCR-assayed titers and letters in red indicating comparisons between plaque assay titers.
