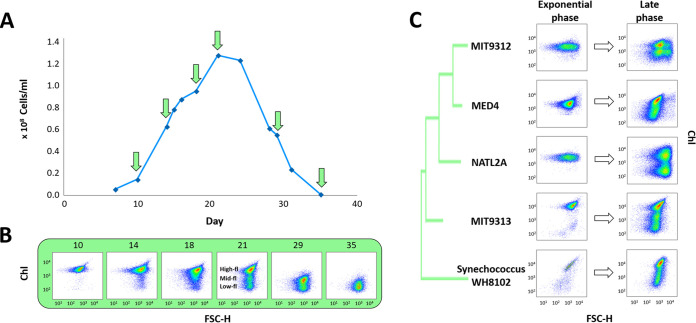
FIG 1.
Emergence of chlorotic subpopulations in Prochlorococcus batch cultures as measured by flow cytometry. (A) Representative growth curve of an axenic culture of MIT9313, grown in Pro99. The arrows mark the days shown in panel B. (B) Flow cytometry scattergrams at the marked time points from the MIT9313 culture. The x axis is the forward scatter (FSC, a proxy for cell size), and the y axis is the chlorophyll autofluorescence of the cells (PerCP). The emergence of chlorotic subpopulation observed from the late exponential phase (day 18). (C) Chlorotic subpopulation observed in aging batch cultures of Prochlorococcus, belonging to different ecotypes: high-light-adapted MED4 (HLI), MIT9312 (HLII), low-light-adapted NATL2A (LLI), and MIT9313 (LLIV). Synechococcus WH8102 is also shown. In all strains, the chlorotic cells begin to emerge at late growth stage, becoming dominant in declining cultures, while in the exponential phase only one population can be observed. Additional growth curves for this strain and for others, including replicates and standard deviations, as shown in Fig. 3 and 4 (see also Fig. S1 to S3, Fig. S5, and Fig. S6 in the supplemental material).

