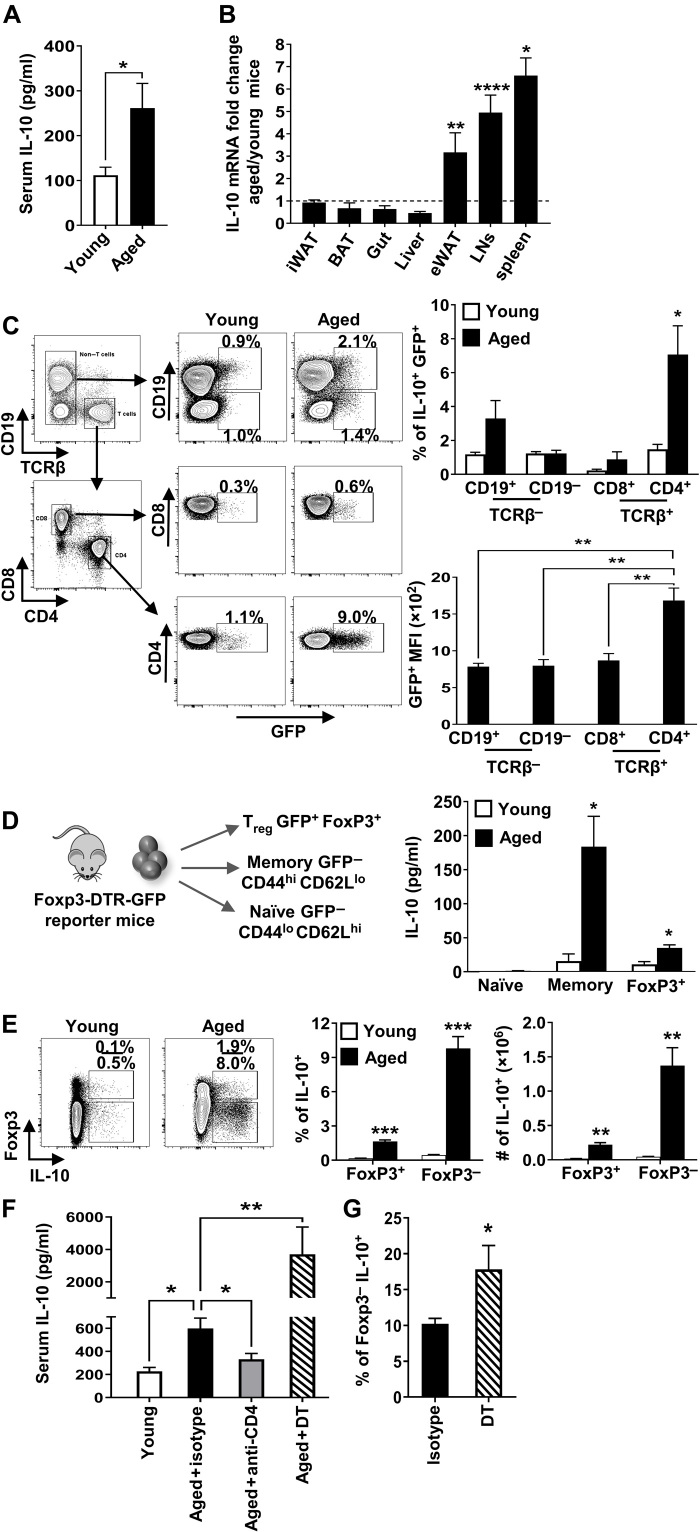
Fig. 1. Aged mice have increased systemic levels of IL-10.
(A) Serum IL-10 (means ± SEM) levels in young (4 months, n = 6) and aged (18 months, n = 5) mice, representative of four independent experiments. (B) Mean fold change in IL-10 mRNA gene expression (means ± SEM) from the spleen, liver, gut, lymph nodes (LNs), inguinal white adipose tissue (iWAT), epididymal white adipose tissue (eWAT), and brown adipose tissue (BAT) from individual young (2 months, n = 4 to 8) and aged (21 months, n = 5 to 9) C57BL/6 mice. Dashed line represents equal aged:young ratio. Data pooled from two independent experiments. (C) Splenocytes from young (1.5 months, n = 3) and aged (18 months, n = 5) IL-10gfp (VertX) mice were analyzed by flow cytometry. Upper graph shows the frequency of cells that are green fluorescent protein–positive (GFP+) (means ± SEM). Lower graph shows the average level of GFP expression in aged CD4+, CD8+, CD19+, and CD19− that are GFP+ (means ± SEM). (D) IL-10 levels (means ± SEM) from phorbol 12-myristate 13-acetate and ionomycin (P + I)–stimulated cells sorted from young (3.5 months, n = 4) and aged (24 months, n = 4) FoxP3–internal ribosomal entry site (IRES)–diphtheria toxin receptor (DTR)–GFP mice. (E) Gating strategy, frequencies, and numbers of FoxP3+ or FoxP3− that are IL-10+ from P + I–stimulated splenocytes from young (1.5 months, n = 4) and aged (23 months, n = 4) C57BL/6 mice (means ± SEM). (F) Serum IL-10 levels (means ± SEM) in young (2.5 months, n = 6) and aged (18 months, n = 14) C57BL/6 mice treated with anti-CD4 or isotype control or DT-treated FoxP3-DTR mice (19 months, n = 6). Data are pooled from two independent experiments. (G) Percentage of FoxP3− splenocytes that are IL-10+ (means ± SEM) from aged (18 months, n = 8) and DT-treated FoxP3-DTR (19 months, n = 6) mice. *P ≤ 0.05, **P ≤ 0.01, ***P ≤ 0.001, and ****P ≤ 0.0001, Student’s t test. MFI, mean fluorescence intensity.

