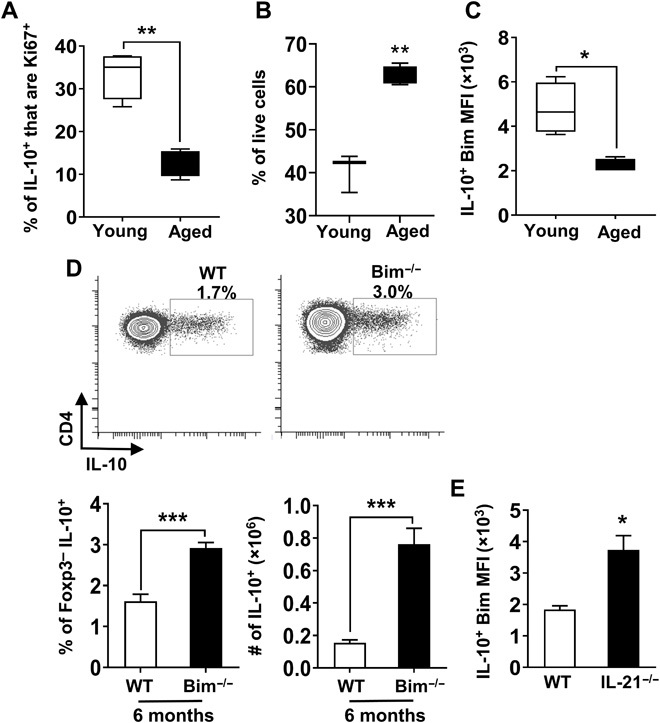
Fig. 5. IL-21–driven repression of Bim in aged Tfh10 cells results in their enhanced survival.

Splenocytes from young (1.5 months, n = 4) and aged (18 months, n = 4) mice were stimulated with P + I, stained, and analyzed by flow cytometry. (A) Graph shows the frequency of FoxP3− IL-10+ cells that are Ki67+ (means ± SEM). (B) Spleen cells were pooled from young (2 months, n = 9) and aged (18 months, n = 6) IL-10gfp (VertX) mice, and CXCR5+PD1+GFP+ cells were fluorescence-activated cell sorting (FACS)–sorted and cultured. After 15 hours in culture, cells were stained for FoxP3 and a viability dye. Graph shows the percentage of live cells in gated FoxP3− cells (means ± SEM). (C) Splenocytes from young (2 months, n = 4) and aged (18 months, n = 4) mice were stimulated as mentioned in (A). Graph shows the level of expression of Bim in FoxP3−IL-10+ cells (means ± SEM). (D) Splenocytes from 6-month-old WT C57BL/6 and Bim−/− mice (n = 6 per group) were stimulated as mentioned in (A), stained, and analyzed by flow cytometry. Plots and bar graphs show the frequency and total number of FoxP3− that are IL-10+ (means ± SEM). (E) Splenocytes from aged (17 months, n = 3 to 4 per group) C57BL/6 or IL-21−/− mice were stimulated as mentioned in (A), stained, and analyzed by flow cytometry. Graph shows the levels of expression of Bim in FoxP3−CXCR5+PD1+ that are IL-10+ cells (means ± SEM). *P ≤ 0.05, **P ≤ 0.01, and ***P ≤ 0.001, Student’s t test.
