
Fig. 3. CPGE spectrum.
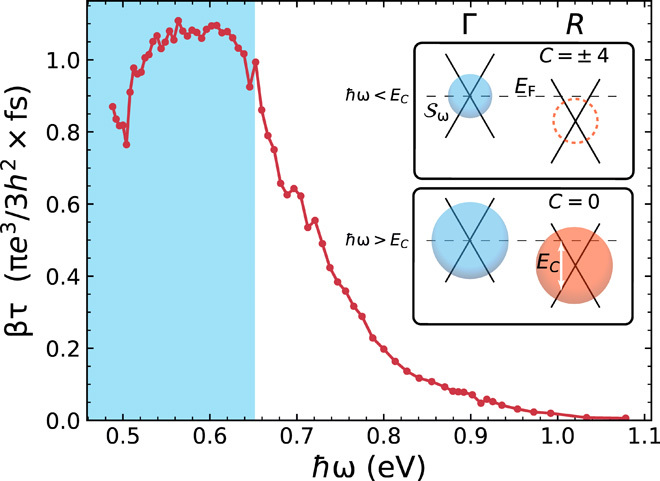
CPGE amplitude βτ in units of fs as a function of photon energy, showing abrupt quenching above 0.65 eV. The inset contains a schematic showing the surface 𝒮ω in k-space defined by the available optical transitions at photon energy ℏω. For ℏω < EC, 𝒮ω encloses a single node and has integrated Berry flux C = ±4. Above EC, it encloses two topological nodes of opposite chirality and C = 0. The blue shaded region in the main plot indicates the region where 𝒮ω encloses only a single node.