
Fig. 4. Reflectivity and optical conductivity.
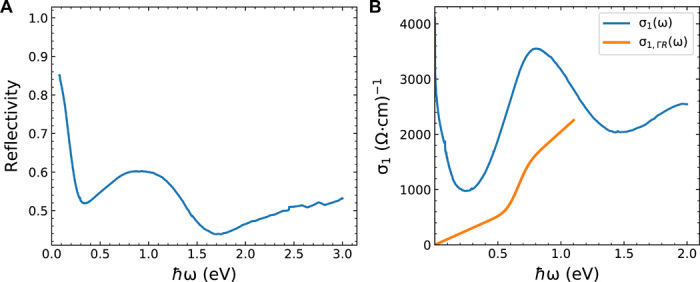
(A) Measured reflectivity of RhSi. (B) Optical conductivity determined by reflectivity measurements and Kramers-Kronig analysis (blue curve). The Drude peak is used to infer that the scattering time has value τ = 8.6 fs. The orange curve represents the optical conductivity from the Γ and R nodes alone (34).