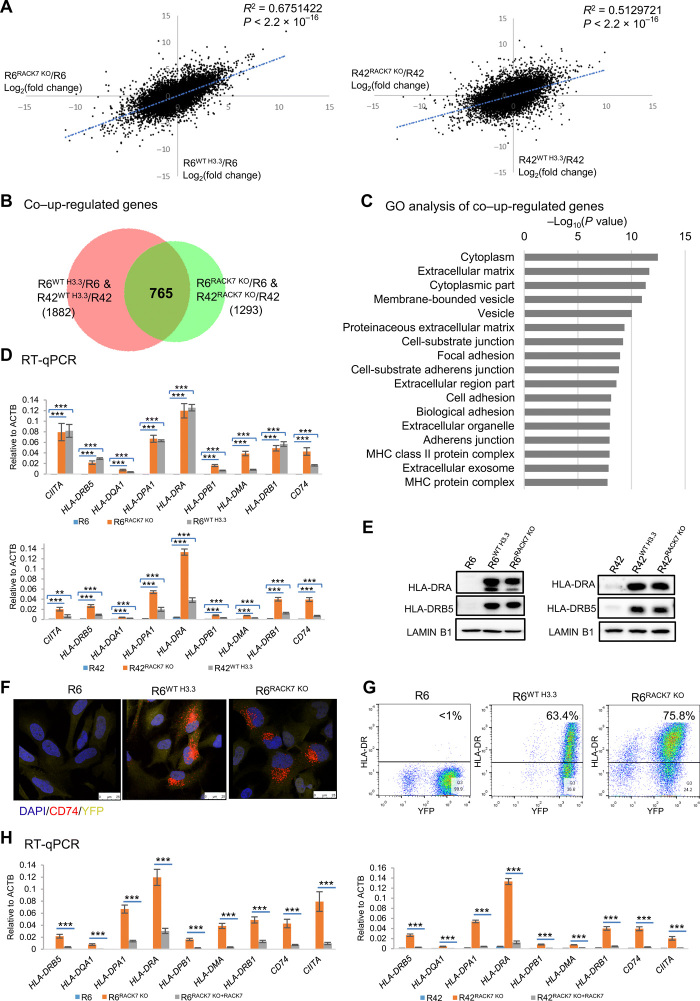
Fig. 4. RACK7 KO has similar effects on gene expression as does H3.3 knock-in, which corrects the G34R mutation.
(A) Scatter plot of log2(fold change) gene expression in R6WT H3.3 and R6RACK7 KO cells (left) and R42WT H3.3 and R42RACK7 KO cells (right), relative to R6 and R42, respectively. Pearson’s product-moment correlation was analyzed by R. (B and C) Venn diagram (B) and GO (C) analysis of co–up-regulated genes [1.5-fold(P < 0.05)] in wild-type H3.3 knock-in and RACK7 KO cells relative to their parental cells. (D) RT-qPCR analysis of mRNA levels of genes in indicated cells. ACTB, actin beta. (E) Western blot analysis of HLA-DRA and HLA-DRB5 in indicated cells. (F) R6, R6WT H3.3, and R6RACK7 KO, which, stably expressing YFP (yellow), were stained for CD74 (red) and 4′,6-diamidino-2-phenylindole (DAPI) (blue) and imaged by confocal microscopy. (G) Flow cytometric analysis of the cell surface expression of HLA-DR in indicated cells. (H) RT-qPCR analysis of select genes in R6, R6RACK7 KO, and R6RACK7 KO rescued with a RACK7 transgene (left), and in R42, R42RACK7 KO, and R42RACK7 KO rescued with a RACK7 transgene (right) cells. Data in (D) and (H) are represented as means ± SD from three biological replicates, **P < 0.01 and ***P < 0.001, two-tailed Student’s t test.

